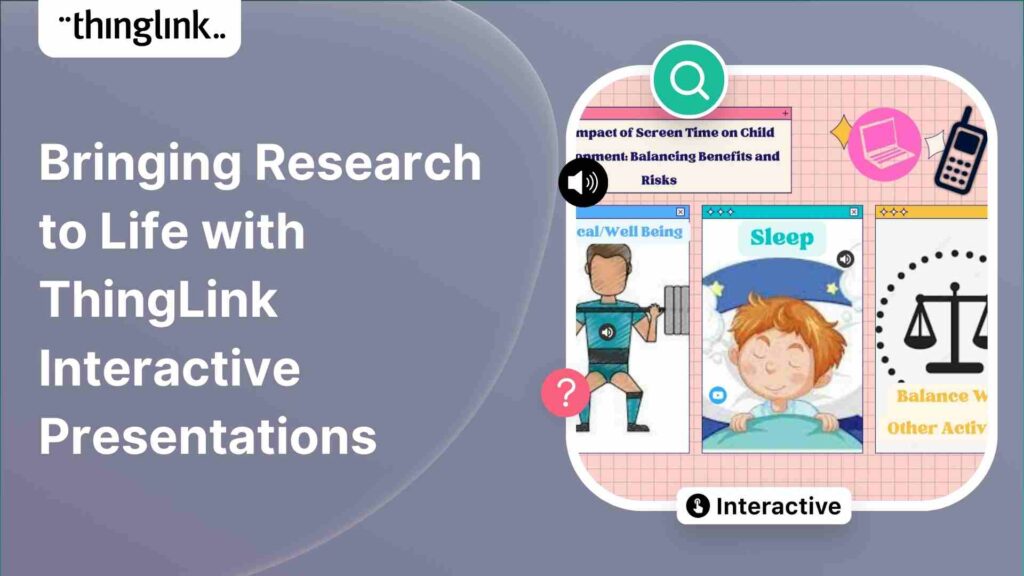
I’ll Be Honest: I Used to Keep VR at Arm’s Length If you have ever felt slightly suspicious of VR headsets in education, or thought they were a bit ...
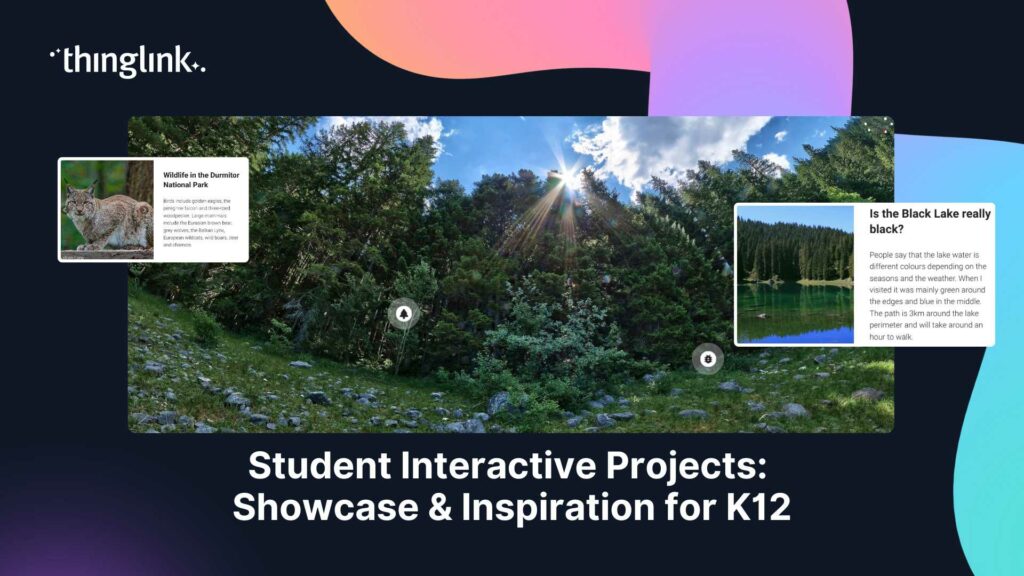
What if your students did not just study a topic, but actually built something with it? Student interactive projects flip the script on traditional assessments....
 Kyla Ball
4 min read
Kyla Ball
4 min read
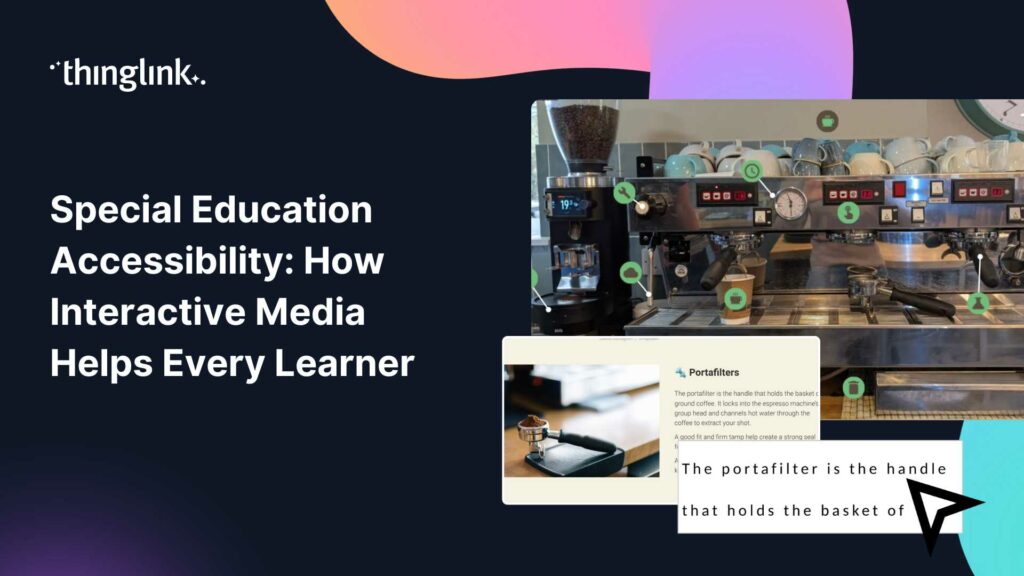
What if every student in your classroom could access the same learning experience, regardless of their communication style, sensory needs, or cognitive profile?...
Kyla Ball
5 min read
Lecturing to a room of disengaged students is one of the oldest frustrations in higher education. You know the material matters. Getting students to genuinely connect...
Kyla Ball
5 min read
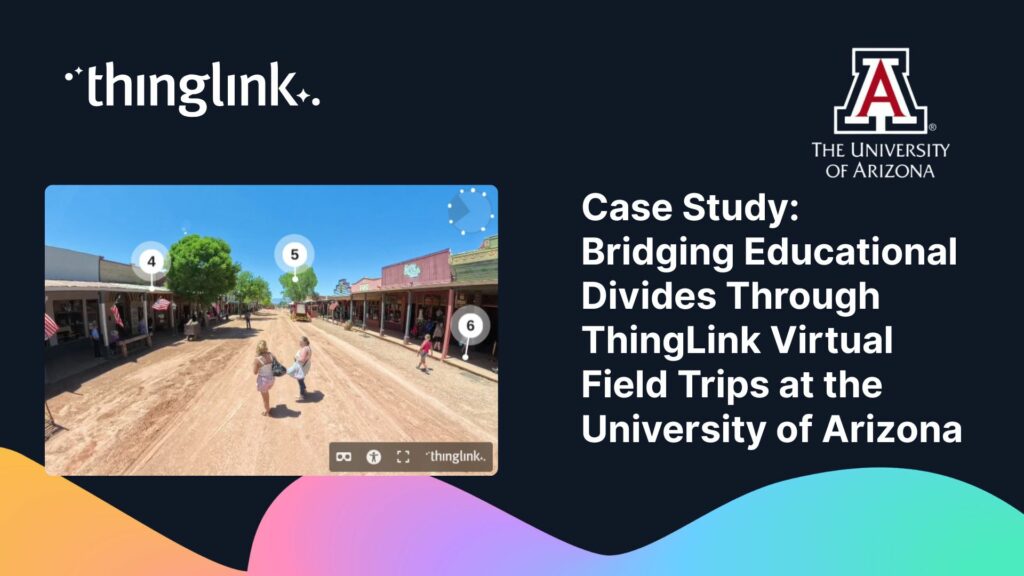
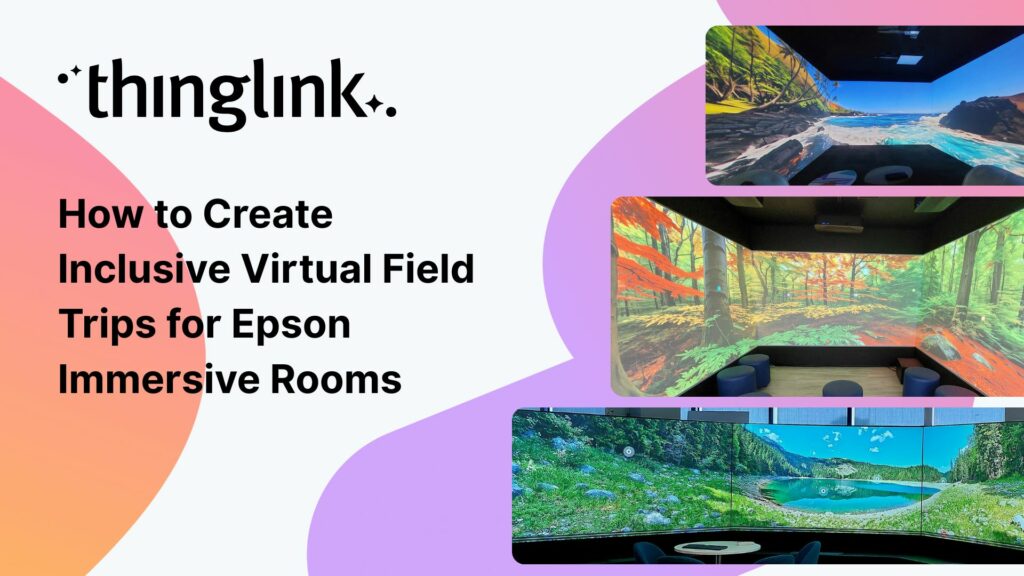
What if every student in your class could visit a mountain observatory, explore a religious site, or step inside a science museum, regardless of mobility, geography,...
Kyla Ball
5 min read
What if a prospective student could walk your campus, peek inside your labs, and feel the energy of your student union, without ever leaving their bedroom? That...
Kyla Ball
5 min read
What if your students were genuinely reluctant to stop learning? Not because you threatened a grade penalty, but because the lesson itself felt too good to quit?...
Kyla Ball
5 min read
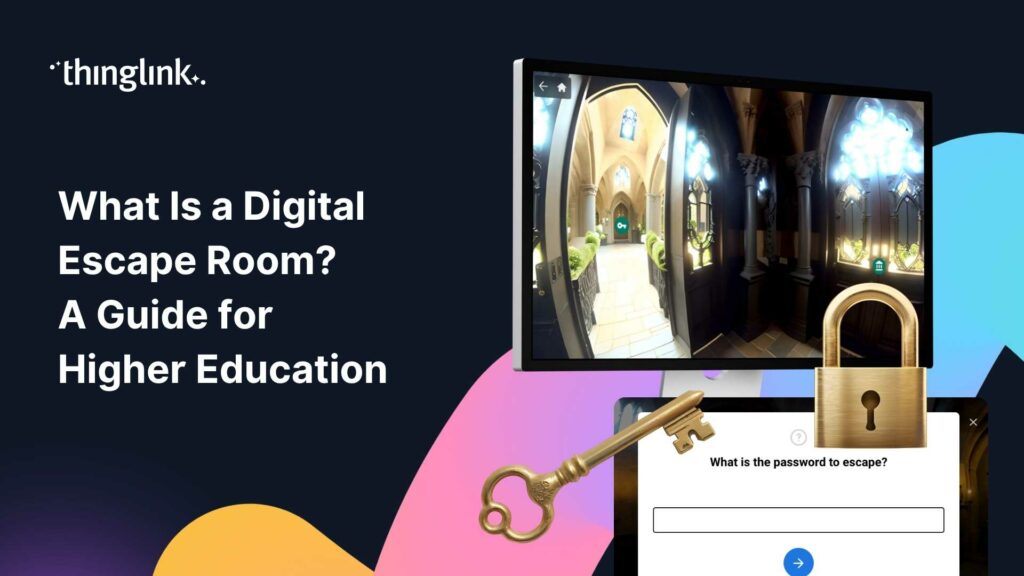
What Is a Digital Escape Room, and Why Are Educators Talking About It? Your students are disengaged. Lecture slides are going unread. Formative assessments feel...
Kyla Ball
5 min read
Digital Storytelling Techniques for the Modern Classroom Humans have always told stories. But the tools we use to tell them have changed dramatically, and so has...
Kyla Ball
7 min read
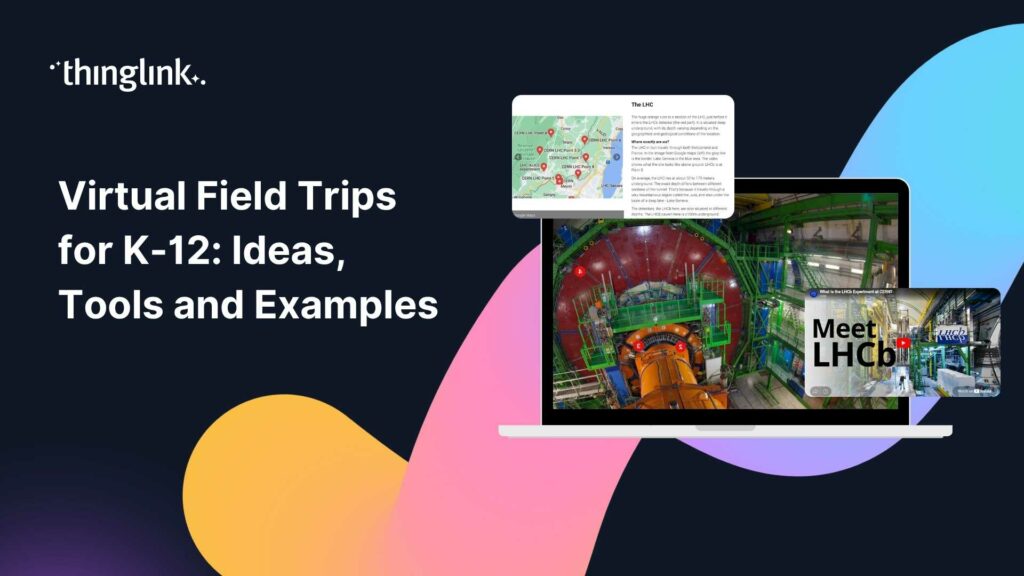
What if your students could stand inside a working observatory, walk the floors of a historic building, or explore a rainforest ecosystem — all before lunch? ...
What if your students could stand inside a volcano, walk the halls of a world-class museum, or explore a university campus without leaving the classroom? Virtual...
Kyla Ball
7 min read
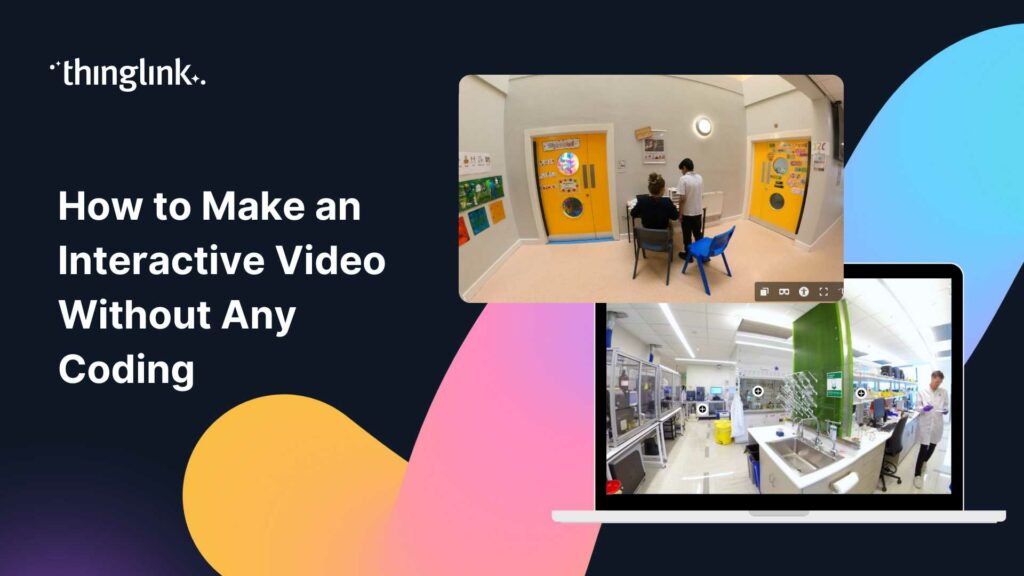
You have great training content. You also have a team of busy learners who click away from passive video within the first two minutes. Sound familiar? Interactive...
Kyla Ball
5 min read
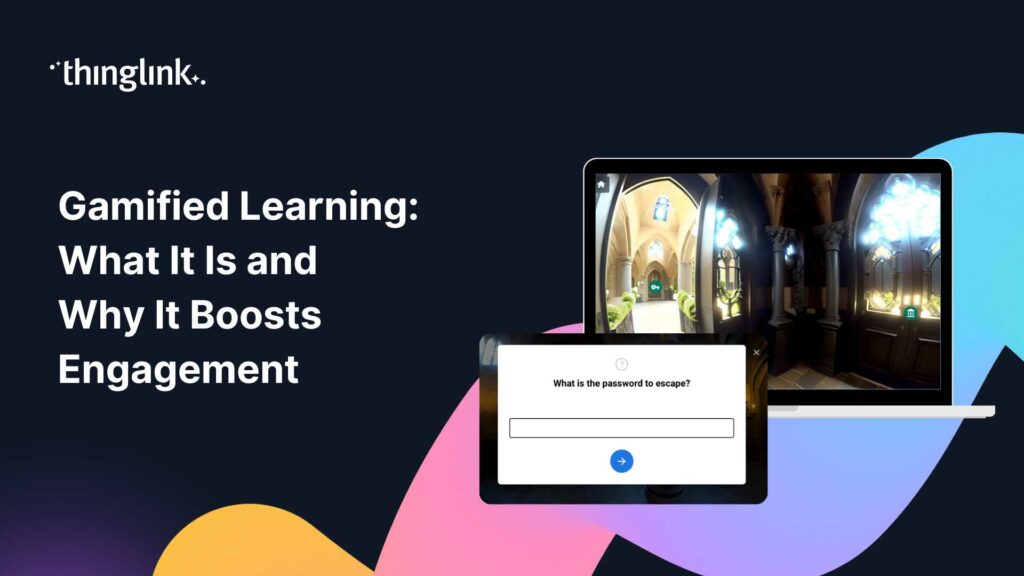
What If Learning Felt More Like Playing? Imagine your students leaning forward in their seats, eager to find out what happens next. Imagine a lecture hall where...
Kyla Ball
7 min read
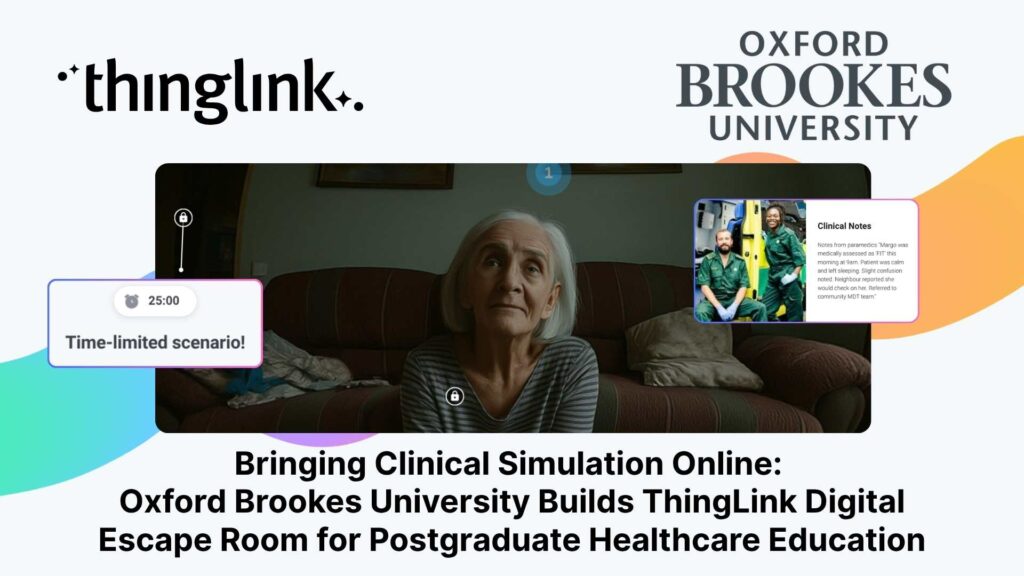
Institution: Oxford Brookes University, Faculty of Health Science and Technology Lead: Emma Mellors, Senior Lecturer Advanced and Specialist Practice / CPD Programmes...
Kyla Ball
4 min read
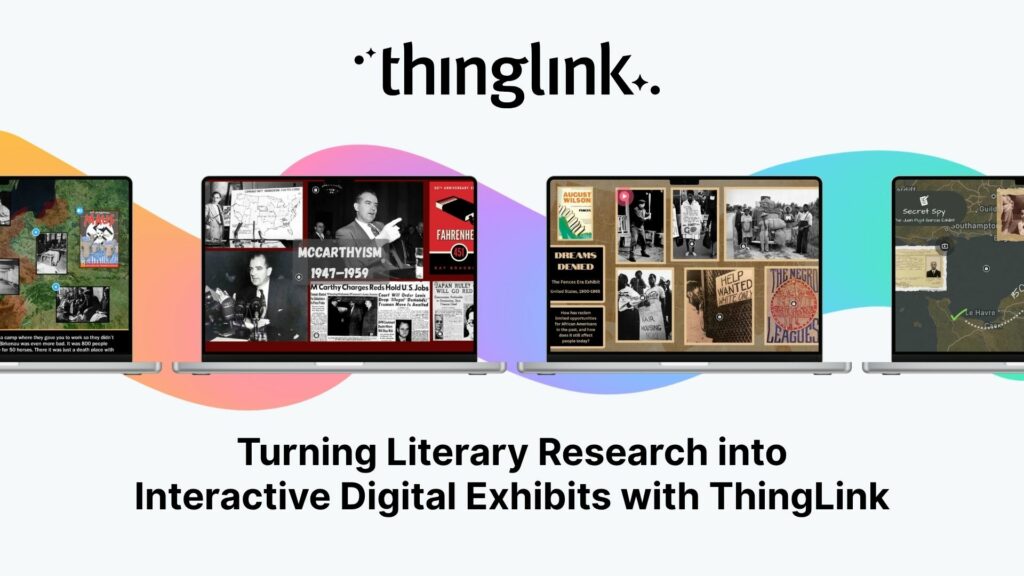
When English teacher Bayly DiPilato set out to reimagine her end-of-year assessment, she had a clear goal: replace the traditional research paper with something...
Kyla Ball
4 min read
ThingLink Luminaries is a series of guest blog posts highlighting certified trainers who are creating interactive and immersive experiences to make learning...
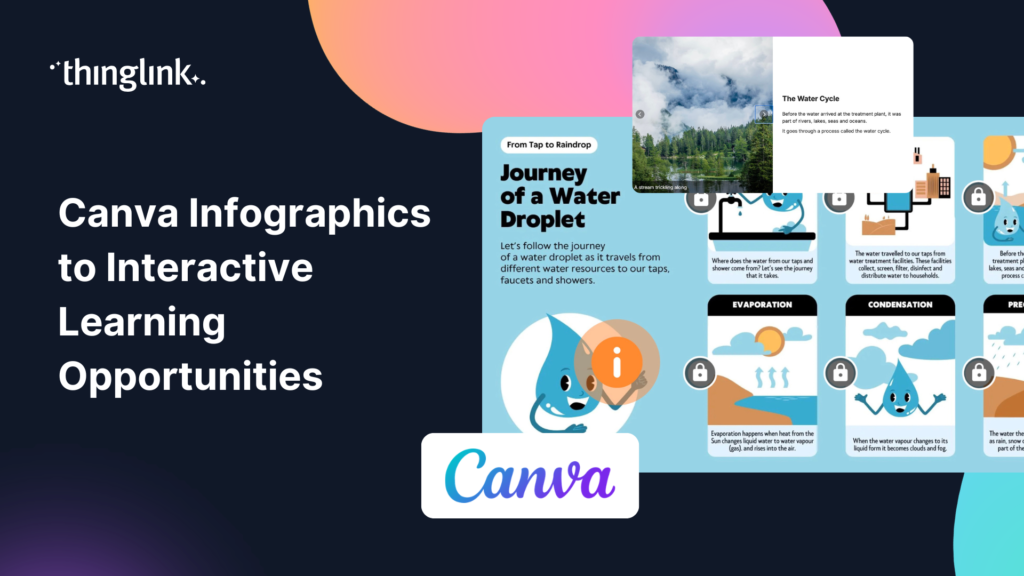
You’ve spent time building a beautiful infographic in Canva. Your students glance at it, maybe read a few bullet points, and move on. Sound familiar? Static...
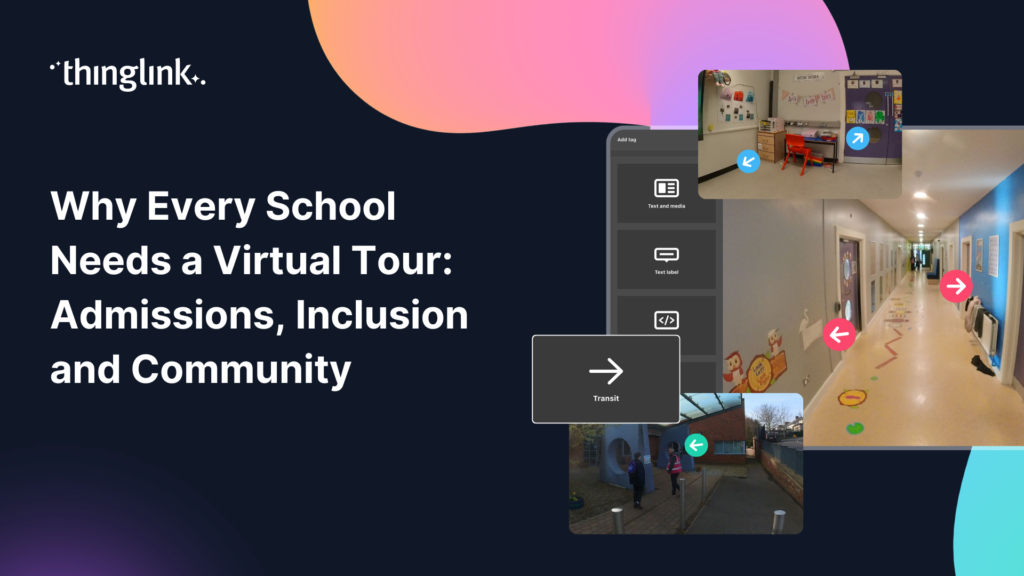
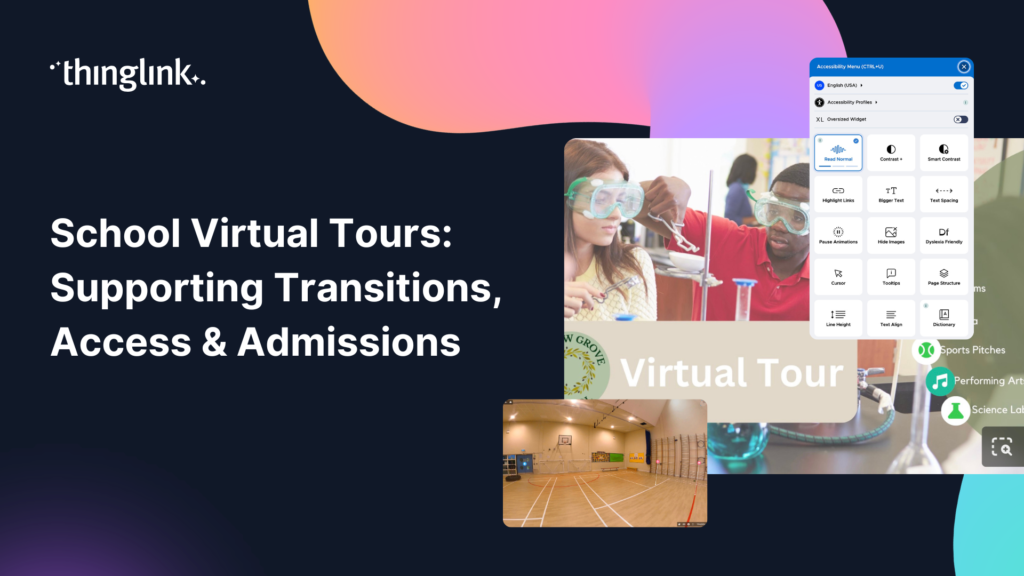
What if every prospective family could walk your school’s corridors before they ever set foot through the door? What if a student with anxiety about starting...
Starting a new school is one of the biggest changes a child faces. For many students, especially those with additional needs, the anxiety of walking into an unfamiliar...
Christopher Sanderson, PhD, is a Senior Lecturer in the Department of Teaching, Learning, and Sociocultural Studies in the College of Education at the University...
Kyla Ball
5 min read
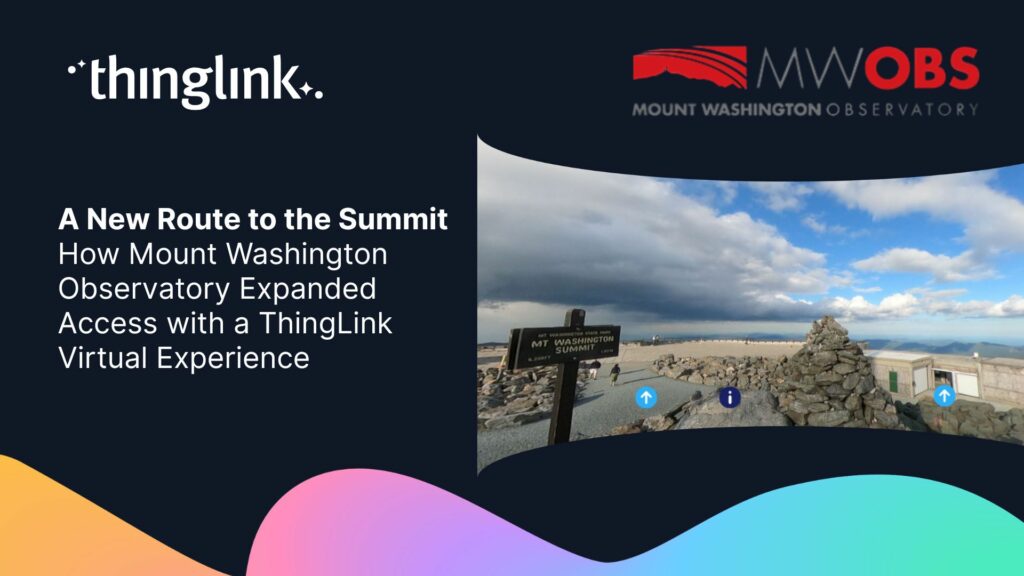
The Background and the Challenge Mount Washington Observatory (MWOBS) sits atop the highest peak in the northeastern United States — home to some of the world’s...
Kyla Ball
3 min read
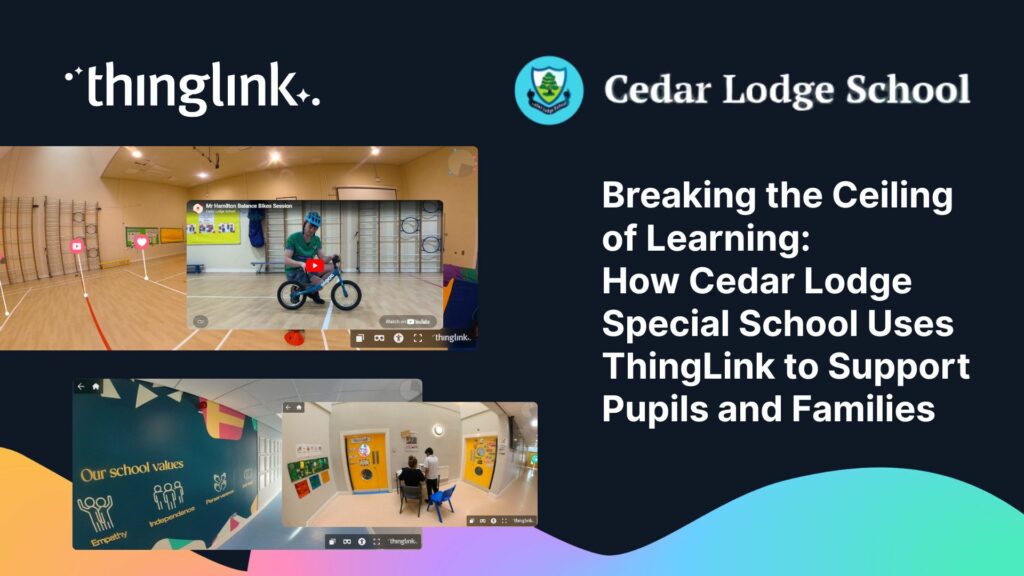
At Cedar Lodge School, Principal Chris Murphy and his team are using ThingLink and other digital tools to create learning experiences that “break the ceiling ...
Kyla Ball
5 min read
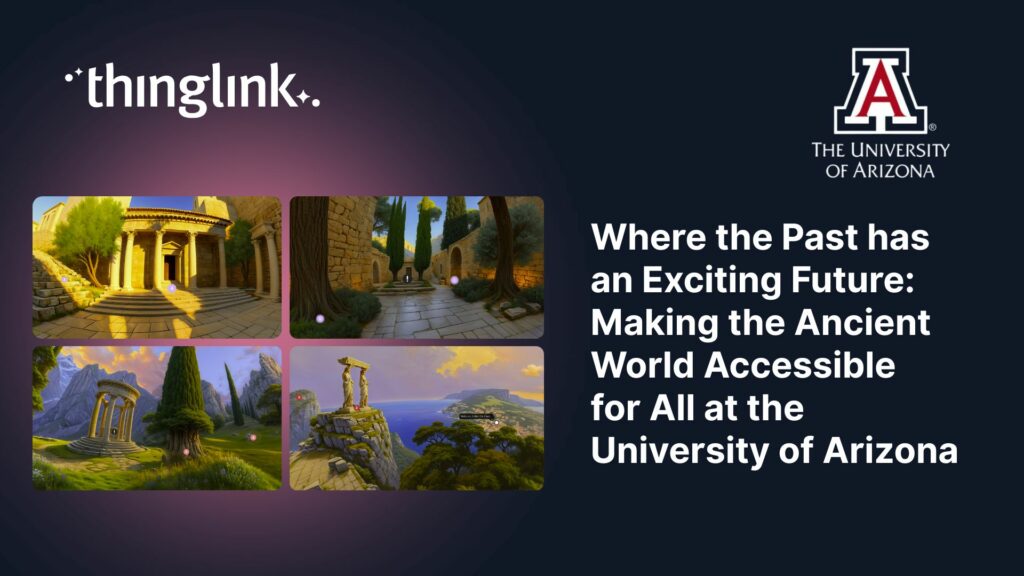
Background Dr. Rob Stephan is a classical archaeologist and Associate Dean of the Franke Honors College at the University of Arizona, whose teaching centers on ...
Kyla Ball
5 min read
Educator Gemma Zeeman is founder of Immersive Discoveries, and a Qualified Teacher who has taught from Reception to Year 6. She currently works as a Research Assistant...
Kyla Ball
8 min read
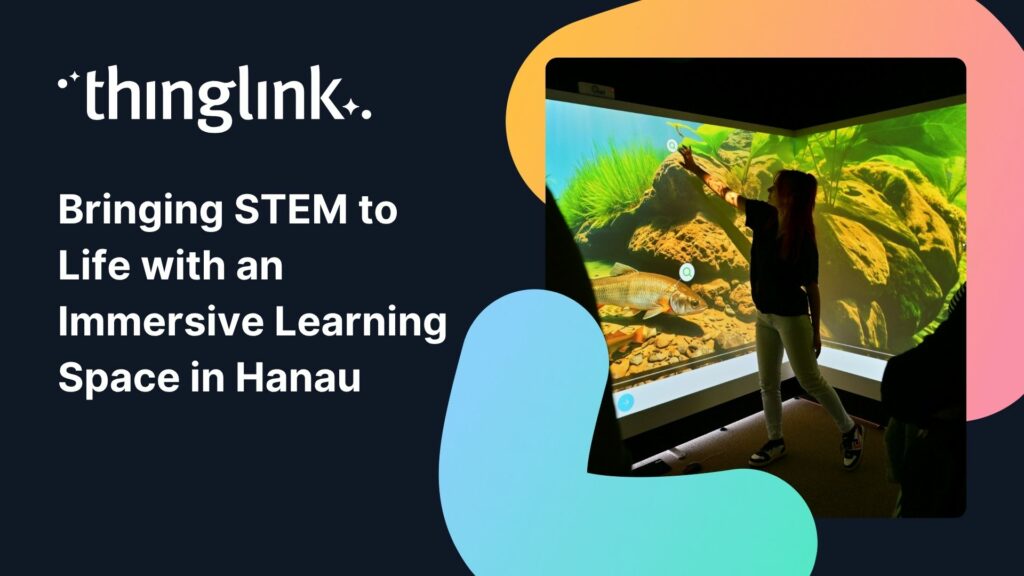
How Kathinka-Platzhoff-Stiftung used ThingLink to build an innovative STEM-focused immersive learning environment – and open it to the whole community. Location:...
Kyla Ball
4 min read
Haaste ISS Palveluiden CMS-yksikkö vastaa siivouksesta, kiinteistöhuollosta ja teknisistä palveluista Joensuun alueella. Business Joensuu hallinnoi Joensuun ...
Kyla Ball
3 min read
Challenge The CMS unit of ISS Palvelut is responsible for cleaning, property maintenance and technical services in the Joensuu region. Business Joensuu manages ...
Kyla Ball
4 min read
What is Immersive Learning? Immersive learning is a modern approach to education and training that uses interactive, spatial experiences to place learners in real-world...
Kyla Ball
6 min read
East Renfrewshire Council’s Education Department sought to improve how they delivered training, shared resources, and communicated with teachers across a diverse...
Kyla Ball
5 min read
Helsinki, 12 March 2026 ThingLink has entered into a strategic partnership with Vervenest Technologies Private Limited to support the expansion of immersive learning...
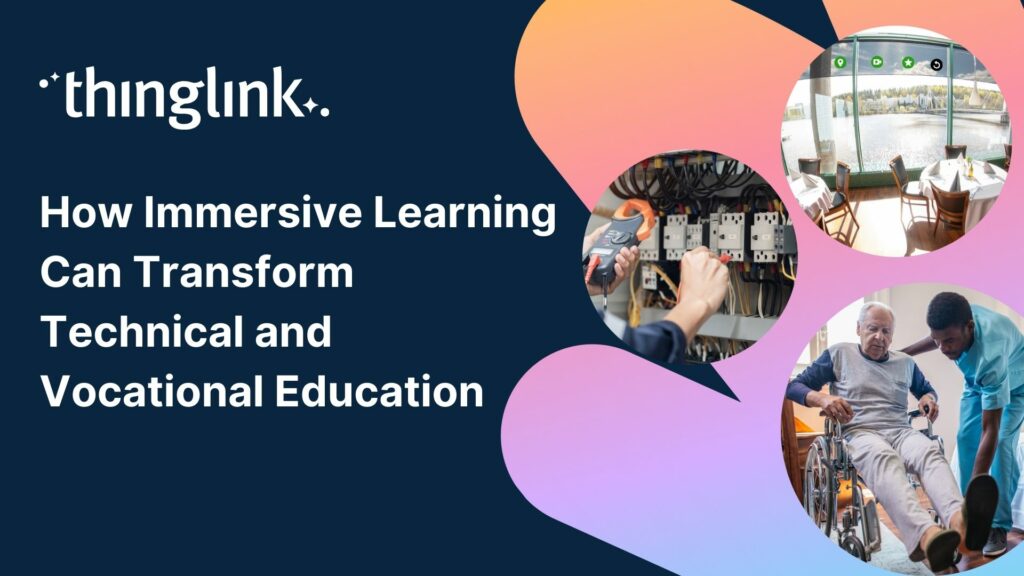
Are you seeking innovative solutions to elevate your vocational education programs? Do you find traditional methods struggle to keep pace with the demands of a ...
Kyla Ball
7 min read
Helsinki, 2 March 2026 ThingLink has signed a Memorandum of Understanding (MoU) with the National Skill Development Corporation (NSDC), under the Ministry of Skill...
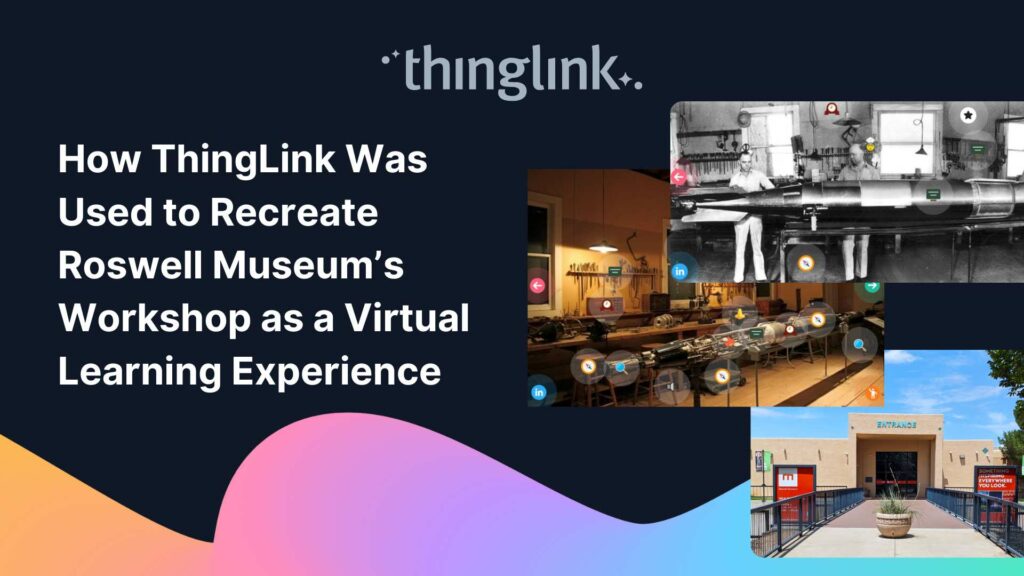
Background: A Museum Lost to Flooding When catastrophic flooding occurred at the Roswell Museum in New Mexico in October 2024, the loss went far beyond physical...
Kyla Ball
6 min read
For students at Spesia vocational and special education college, ThingLink isn’t just a learning platform, but a tool for designing and building their own interactive...
Kyla Ball
5 min read
Background Tankespirerne (translated as “Thought Sprouts”) is a Danish educational consultancy led by Martin Kongshave, elementary school teacher and practitioner...
Kyla Ball
5 min read
Instructure is the global EdTech organization used by over 19 million unique users annually. It’s probably best-known as the home of Canvas, their flagship product...
Kyla Ball
5 min read
With more than 7,000 learners but only two dedicated digital learning designers, Bradford College faces a challenge familiar to many Further Education institutions:...
Kyla Ball
4 min read
Transforming Education with Gamified Learning Experiences Education stands on the edge of a significant transformation, driven by innovative technologies that redefine...
Kyla Ball
5 min read
This teacher training resource for students on the PGCE course (Post Graduate Certificate in Education) demonstrates how ThingLink can be used to create interactive...
Kyla Ball
4 min read
For many higher and further education institutions, the integration of new technologies like AV equipment often presents a double-edged sword. While advancements...
Kyla Ball
6 min read
Plans for Every Educator and Every Institution We’ve listened to educators about what they need from their ThingLink plans for their students, school districts,...
Nutrition and dietetics higher education programs face a critical challenge common across healthcare studies: effectively connecting theoretical knowledge with ...
Kyla Ball
9 min read
Some further education courses can move online easily, but how do you engage your online students in hands-on subjects involving machinery, materials and complex...
Kyla Ball
5 min read
Creating accessible learning experiences is critical for educators, trainers and student creators, but it need not be daunting! ThingLink is a platform that allows...
¿Alguna vez has deseado llevar a toda tu clase a la selva amazónica, a la superficie de Marte o a los pasillos del Louvre o del Smithsonian… todo antes del ...
 Joseph Mayo
4 min read
Joseph Mayo
4 min read
Ever wished you could take your entire class to the Amazon rainforest, the surface of Mars, or the halls of the Louvre or the Smithsonian… all before lunch? ...
Joseph Mayo
4 min read
A medida que el aprendizaje inmersivo continúa transformando las aulas en todo el mundo, cada vez más escuelas y universidades están comenzando a explorar el...
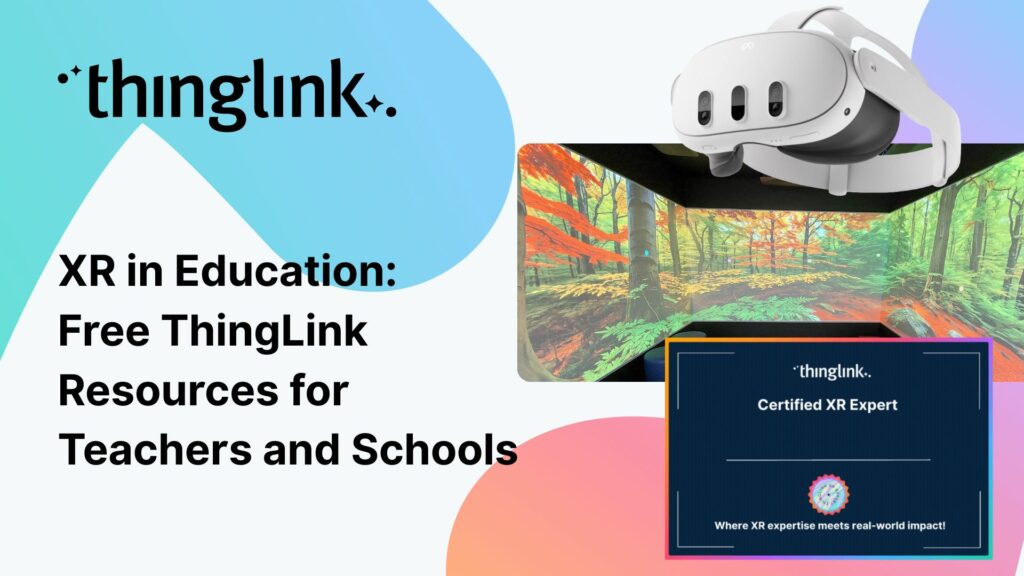
Para que tu camino en la creación de contenido educativo en XR sea lo más sencillo posible, hemos seleccionado una colección de recursos gratuitos que te ayudarán...
To make your journey through XR learning content creation as easy as possible, we’ve curated a collection of free resources that will help get you started. Packed...
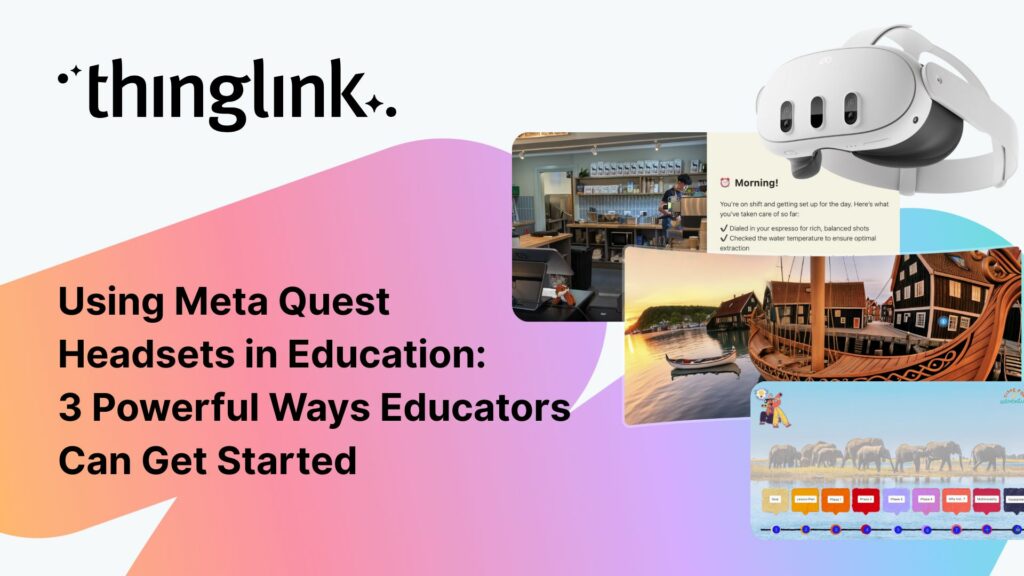
As immersive learning continues to transform classrooms around the world, more schools and colleges are beginning to explore the potential of Meta Quest headsets...
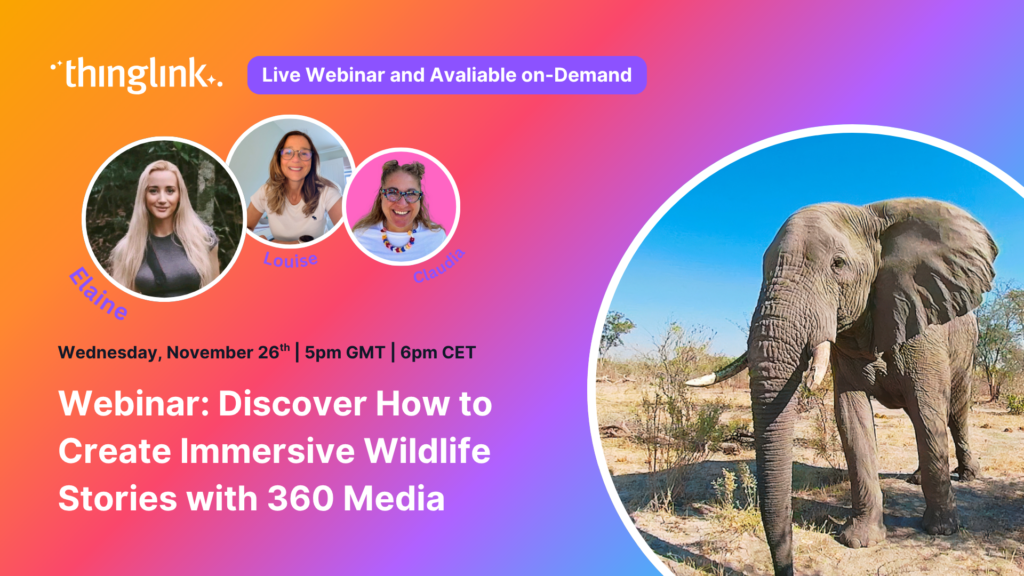
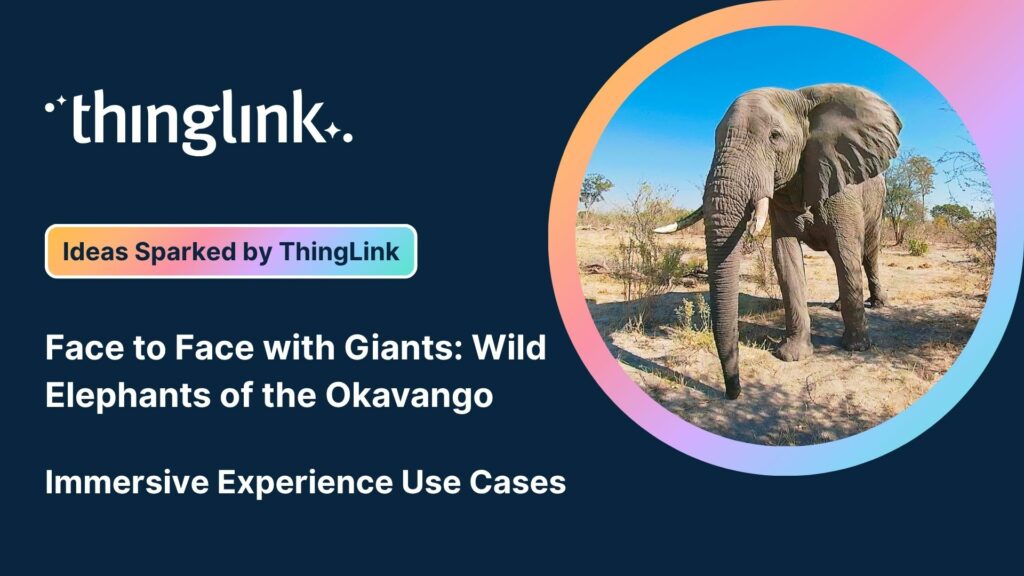
🐘 Inspire young minds to explore, protect and connect with nature using immersive storytelling, 360° content and ThingLink’s creative tools. Join us for an...
ThingLink has recently made available an inspiring set of three conservation-based 360° videos, designed for learners, educators, and anyone curious about how ...
Kyla Ball
4 min read
From transmission network operators in Finland to a renewables training academy in Scotland, manufacturers in the U.S., and global industrial leaders, ThingLink...
Kyla Ball
6 min read
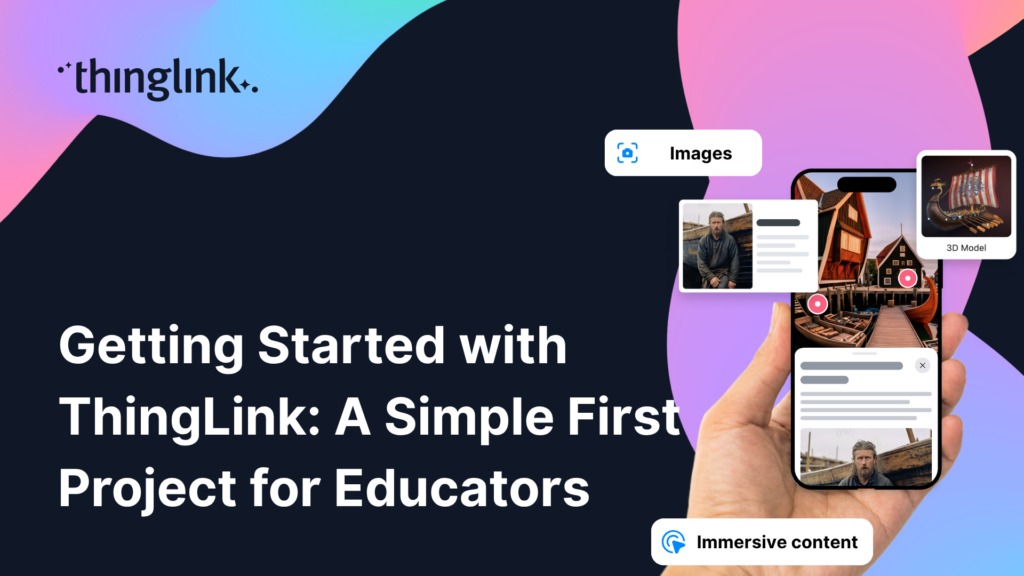
ThingLink is a fantastic tool for creating interactive and immersive images, videos, and virtual tours. It allows you to bring visuals to life by adding hotspots,...
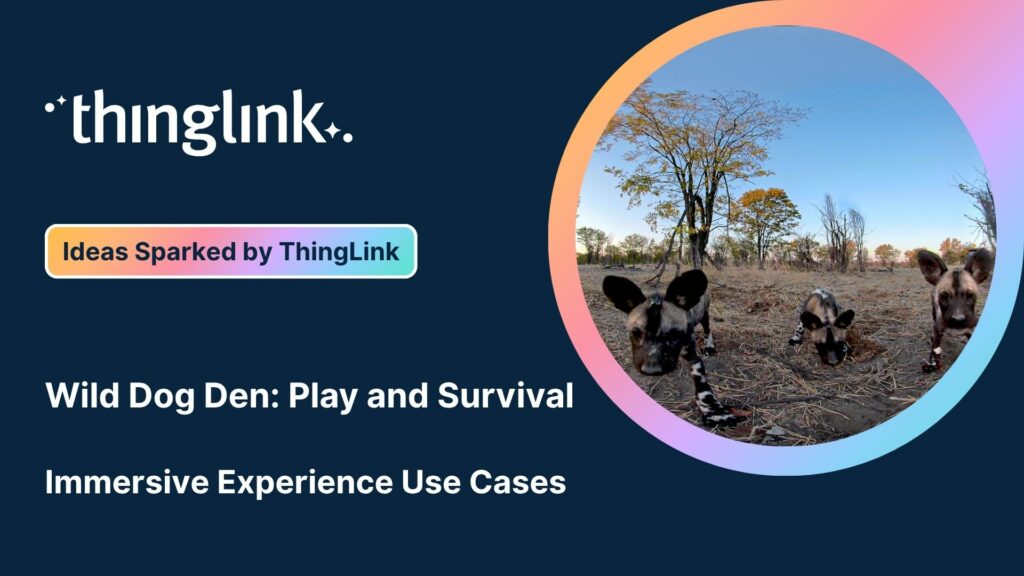
We’re delighted to collaborate with Elaine Ford to bring you a truly unique collection of 360° video footage captured in the wild. These immersive scenes offer...
We’re delighted to collaborate with Elaine Ford to bring you a truly unique collection of 360° video footage captured in the wild. These immersive scenes offer...
We’re delighted to collaborate with Elaine Ford to bring you a truly unique collection of 360° video footage captured in the wild. These immersive scenes offer...
At Hackbridge Primary, the introduction of ThingLink has transformed teaching and learning in a range of ways. In just a year, staff have seen shifts in how pupils...
Kyla Ball
5 min read
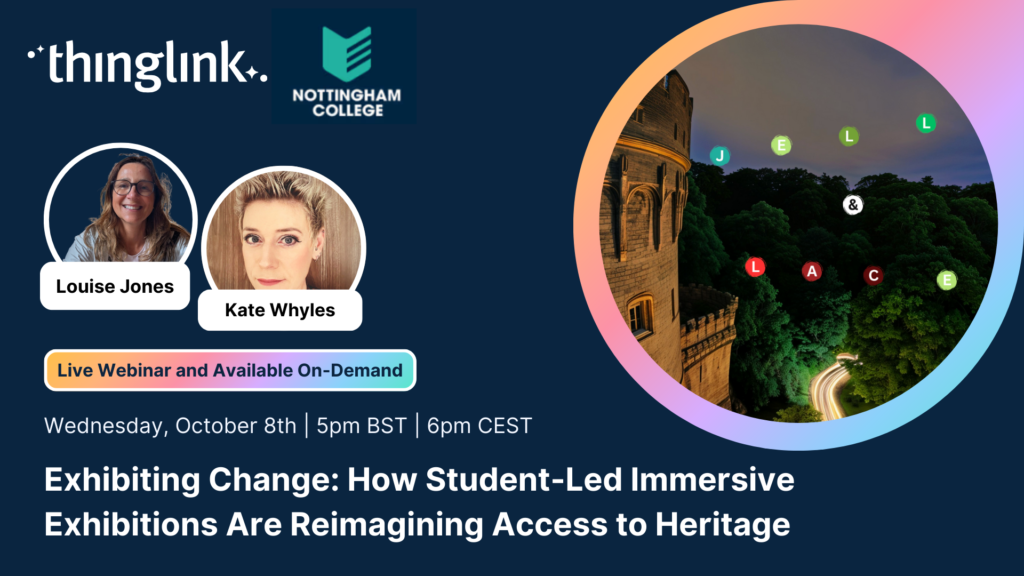
Join Nottingham College’s Digital Innovation and Development Coach (and ThingLink Certified Trainer) Kate Whyles to hear about two inspiring case studies where...
Webinar: Reimagining Learning: A Roundtable with ISTE Authors on Immersive EdTech and ThingLink in Action! ✨ Featuring ISTE Recognised Authors: Karalee ...
Education Special | From Cupboard to Classroom: Getting the most out of your VR Headsets! Have a set of VR headsets sitting in the cupboard, barely touched since...
Creating Interactive Simulations for Real-World Readiness: Immersive Learning for Medical Schools & Healthcare Teams Where and When 📅 Date: Now On-Demand...
LEO, a forward-thinking British multi-academy trust, has pioneered a structured, pedagogy-first approach to digital learning that has driven significant gains in...
 Louise Jones
10 min read
Louise Jones
10 min read
New Caney Independent School District (ISD) added ThingLink to their roster of online learning resources in 2020 and it soon became a valuable tool with many applications....
At ThingLink, our mission is to empower educators, trainers, and content creators to build truly impactful digital learning experiences. We believe that great learning...
Solve System-Wide Challenges with Easy Creation, XR/VR Integration & Interactive Content Join Louise, ThingLink and Cheryl Shirley, Director of Digital Learning...
The other day I was watching my close friend’s seven-year-old son do something that completely stopped me in my tracks (if you’ll excuse the pun). Nico...
The foundations of ThingLink are rooted in the socio-cultural theory of learning developed by Lev Vygotsky. My own journey began in 2003 at the Center for Activity...
When their usual arts venue became unavailable for Nottingham College’s end-of-year show, the organizers found the ideal way to recreate and share the works...
Kyla Ball
4 min read
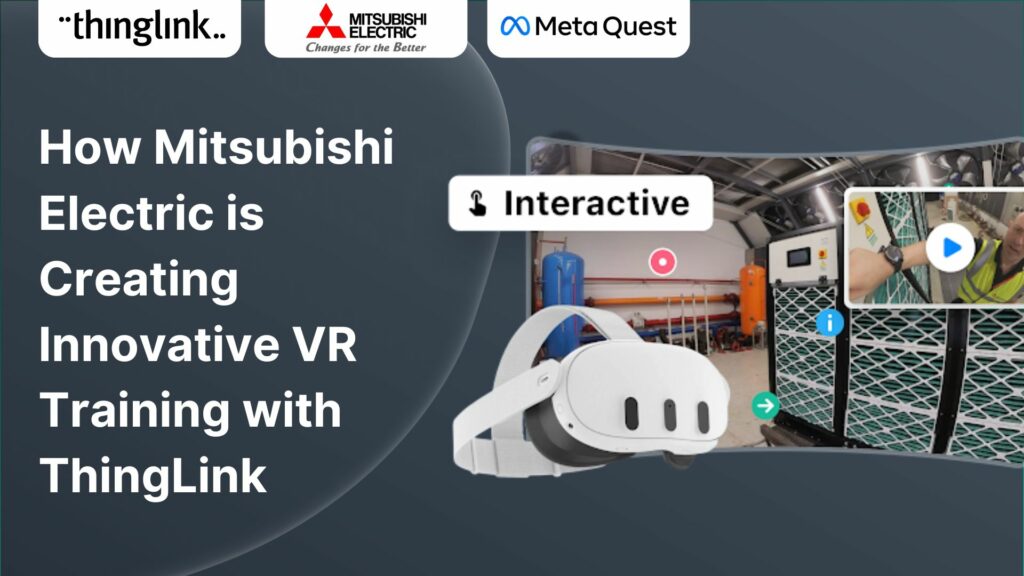
How Mitsubishi Electric UK Scales Immersive VR Training with ThingLink Securing the Next Generation of Engineers: How Mitsubishi Electric is Solving the Talent ...
Turn Summer Experiences into Story-Driven Learning: How Students Can Capture and Reflect using Immersive Journals Make it a Summer to Remember Join Louise Jones...
Background Texas Christian University (TCU) is a private university of around 9000 undergrads, situated in the city of Fort Worth within the Dallas Fort Worth metroplex....
Kyla Ball
7 min read
Stockholm, April 8th, 2025 – ThingLink, the leading platform for creating and sharing immersive learning experiences across platforms and devices, is now available...
Immersive learning technologies like ThingLink are transforming education! Research shows they improve engagement, comprehension, and knowledge retention—making...
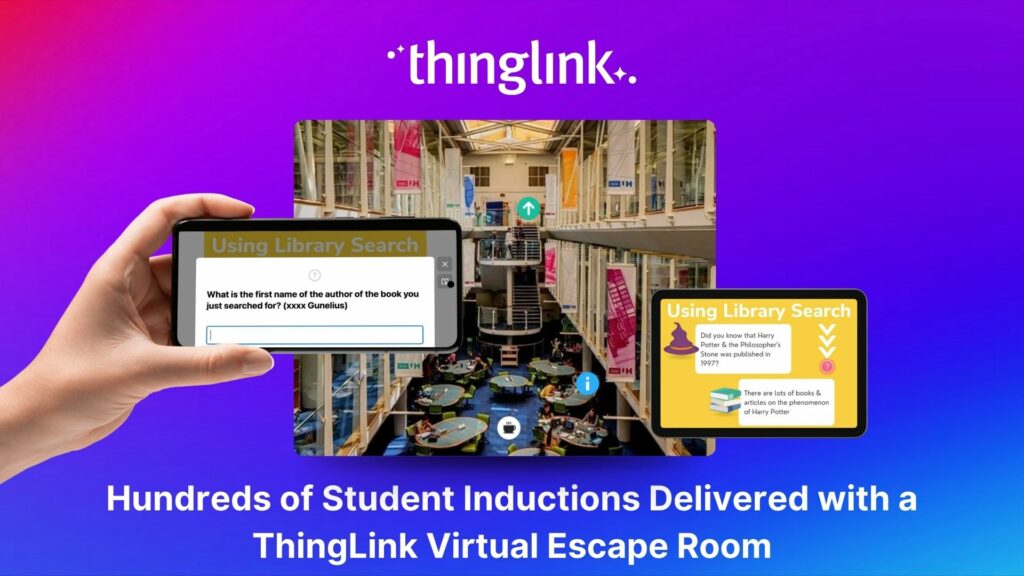
Louise Conway, Information Manager at the University of Hertfordshire (UK) has created an ingenious, engaging virtual escape room to ensure that new students are...
Kyla Ball
7 min read
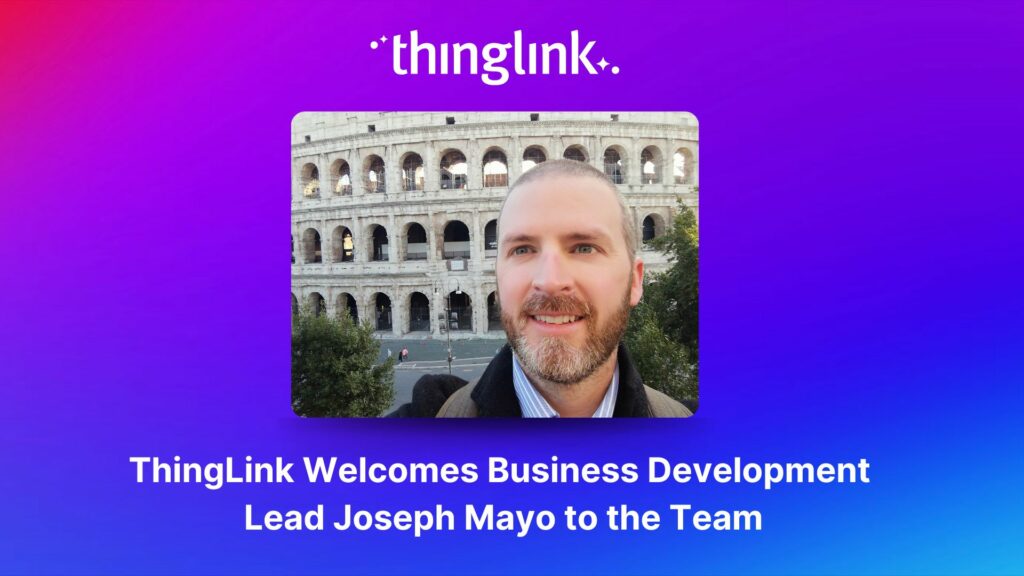
ThingLink, the AI-assisted immersive content creation platform for training and education, continues to grow its global team alongside the expansion and development...
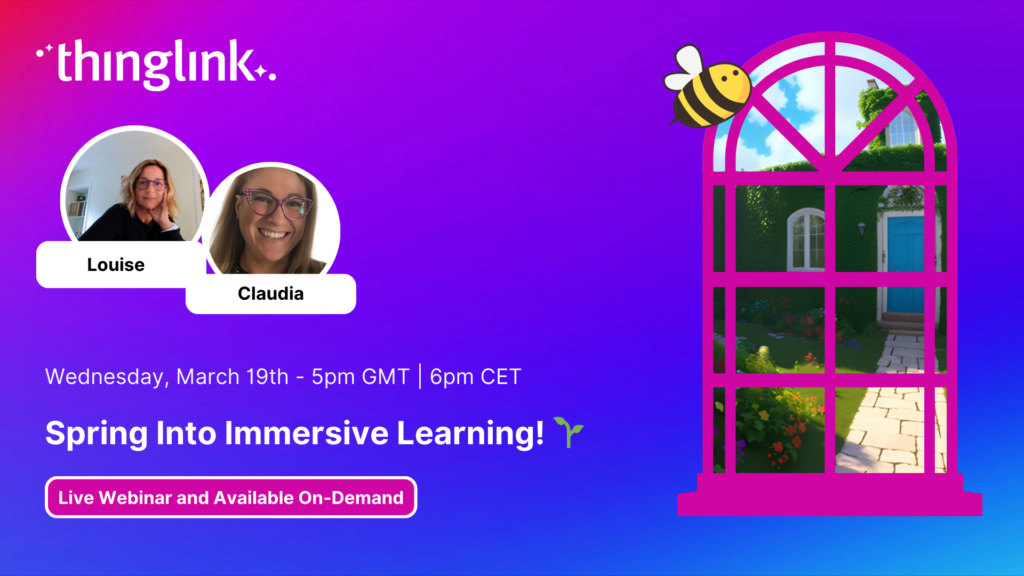
Spring into Immersive Learning! 🌱 Join your hosts Louise and Claudia for a playful and engaging session on the rise of immersive learning! We’ll explore new...
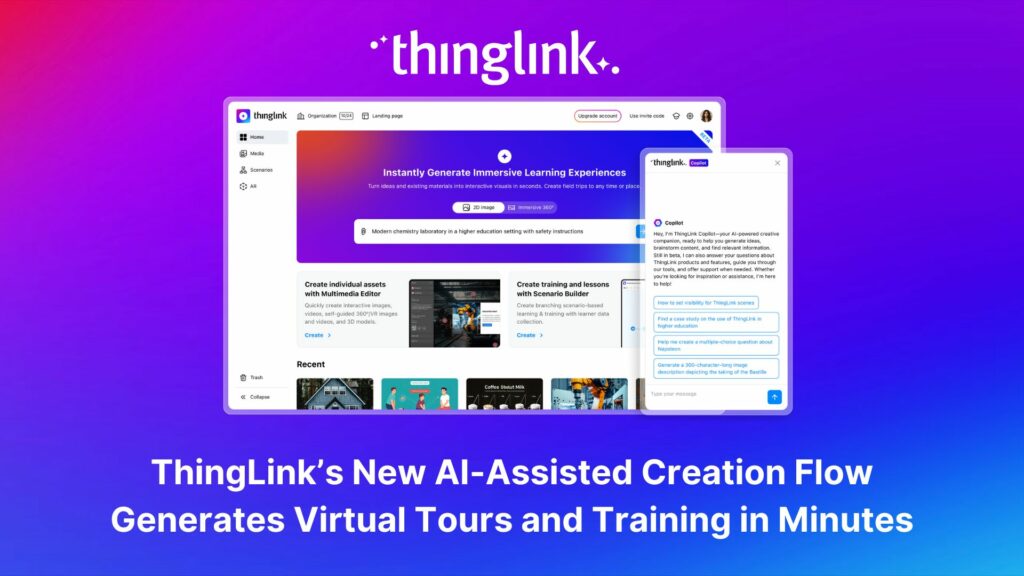
As digital transformation accelerates across industries, the demand for intuitive AI tools that empower non-technical users to create sophisticated learning experiences...
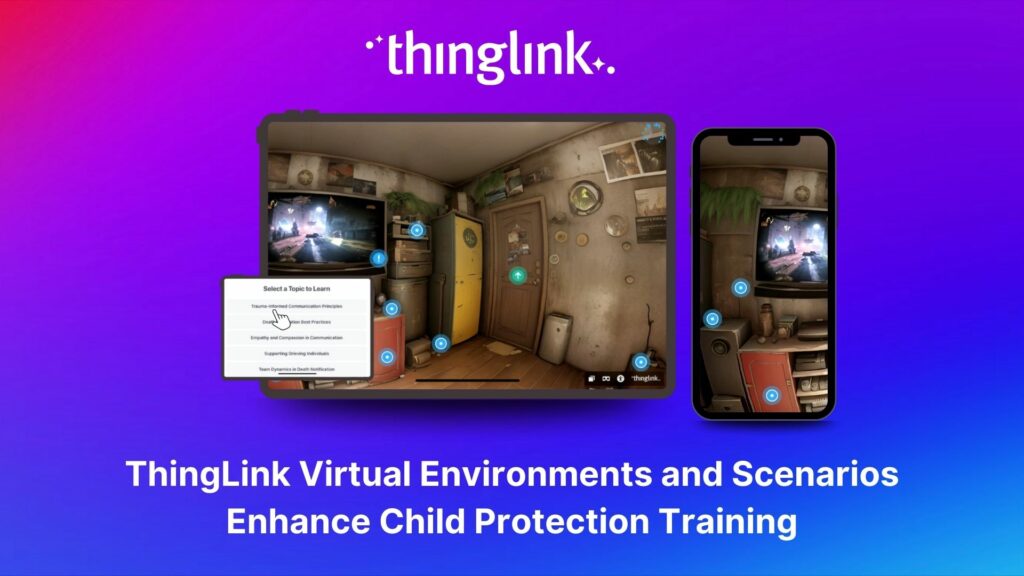
Background Zero Abuse Project (founded in 2018) is a non-profit organization based in the US. Their mission is “To protect children from abuse and sexual assault,...
Kyla Ball
8 min read
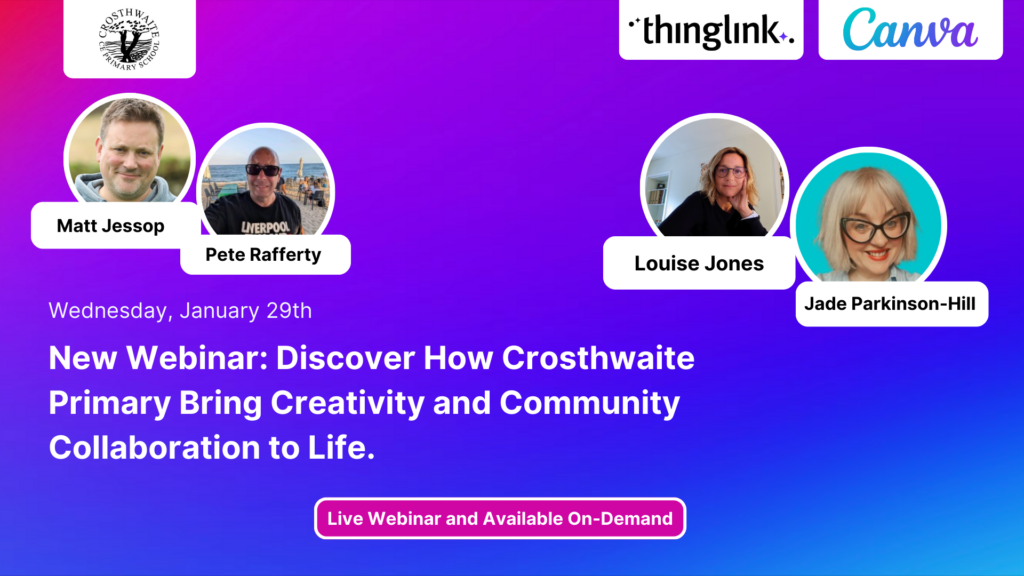
Join us for an inspiring and practical webinar where Crosthwaite Primary School share how they’ve designed their curriculum to foster creativity, community collaboration,...
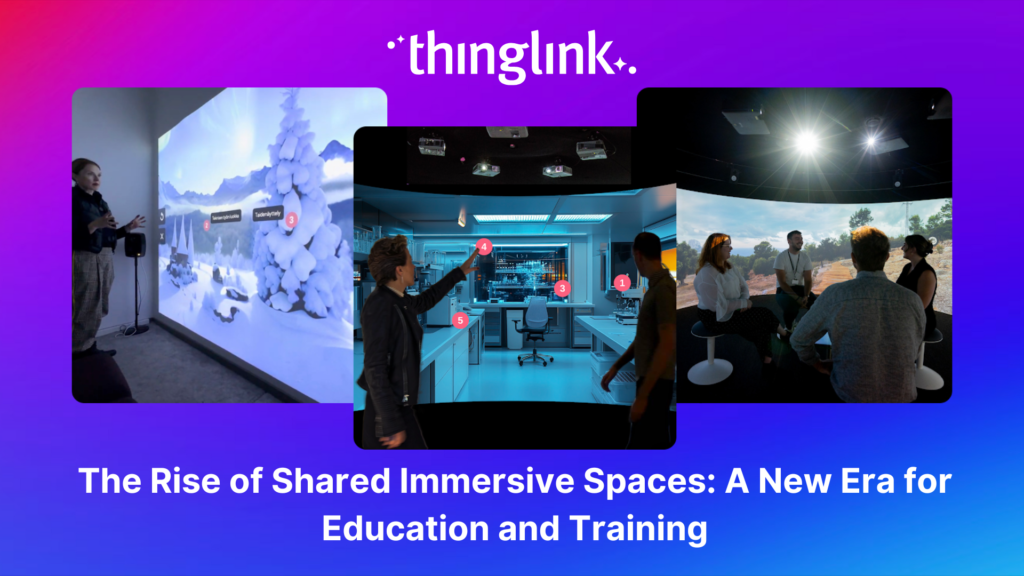
The increasing interest and adoption of shared immersive spaces in recent years reflects a shift in the way we see the future of learning, future of education, ...
Join us for an unmissable webinar celebrating a year of innovations with ThingLink! 🌟 We are excited to invite you to discover all the incredible updates we’ve...
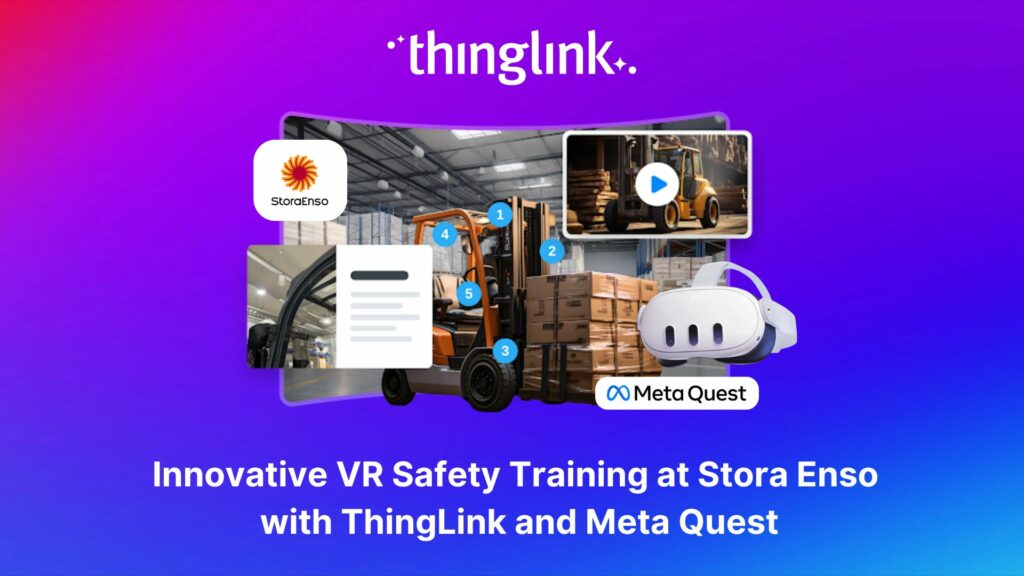
Updated 18.6.2025 Background Stora Enso is a company based in Finland and Sweden, and develops solutions based on wood and biomass for a diverse range of industries...
Kyla Ball
5 min read
Join us for an exclusive look into how Canva and ThingLink complement each other to create a powerful toolkit for immersive learning experiences! Are you ready ...
Are you ready to move beyond the classroom and explore the world of Learning and Development (L&D)? Join us for an exciting free webinar featuring two esteemed...
Join us for an exciting exploration of ThingLink’s updated Scenario Builder! In this session, we’ll showcase two powerful paths for scenario creation: building...
Education is changing fast, and immersive learning is playing an important role in shaping the future of how we teach and engage students. Watch our exciting...
Introduction With the development of new technologies, the boundaries between physical and digital learning spaces are being redefined. Yet, these environments ...
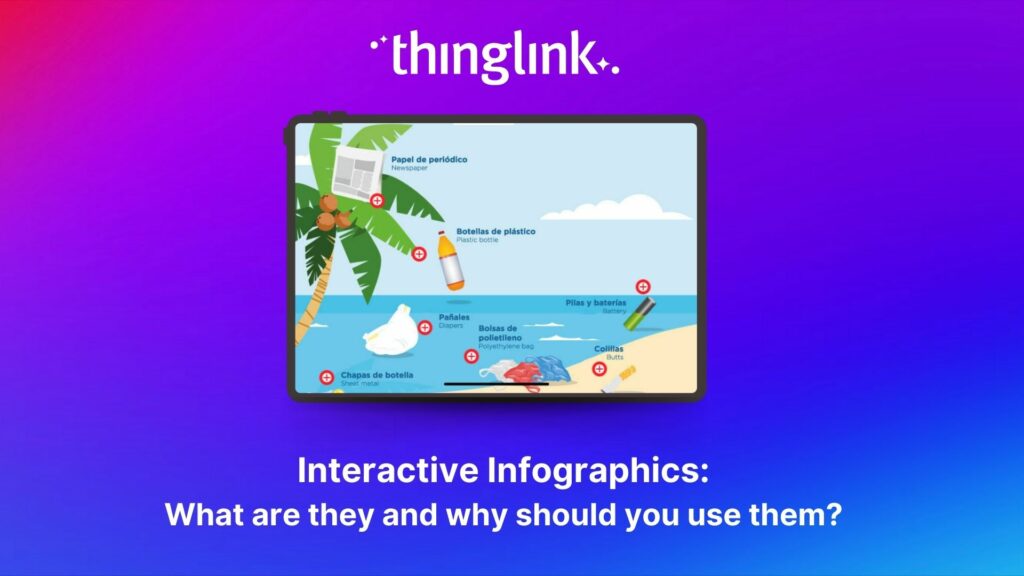
Infographics are the fastest and easiest way to present any complex information. In this blog we’ll show you how to create interactive infographic designs even...
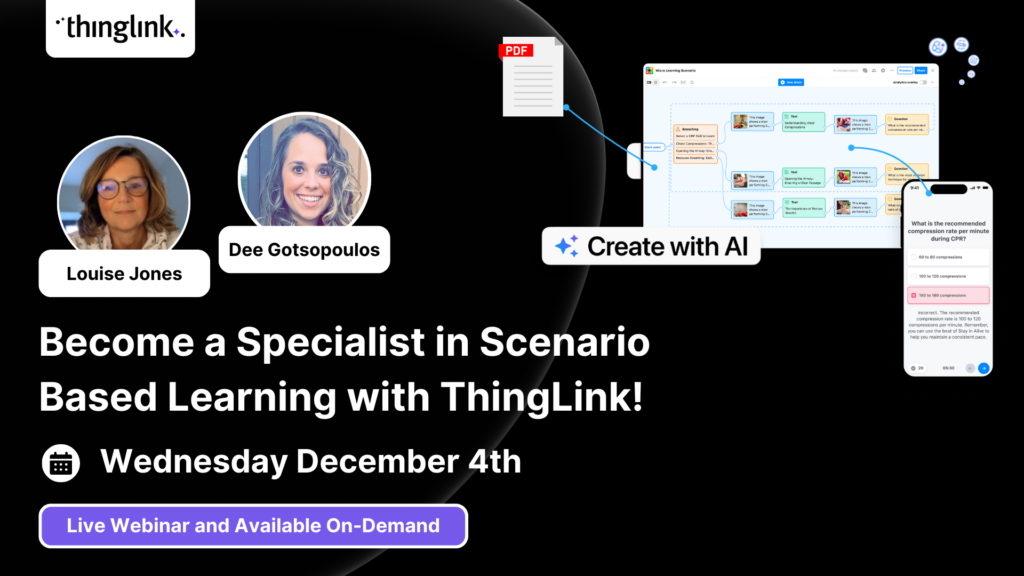
Discover the New ThingLink Scenario Builder and Ways to Transform the Static to Interactive In Fall 2024, ThingLink revolutionized the world of Scenario Based Learning...
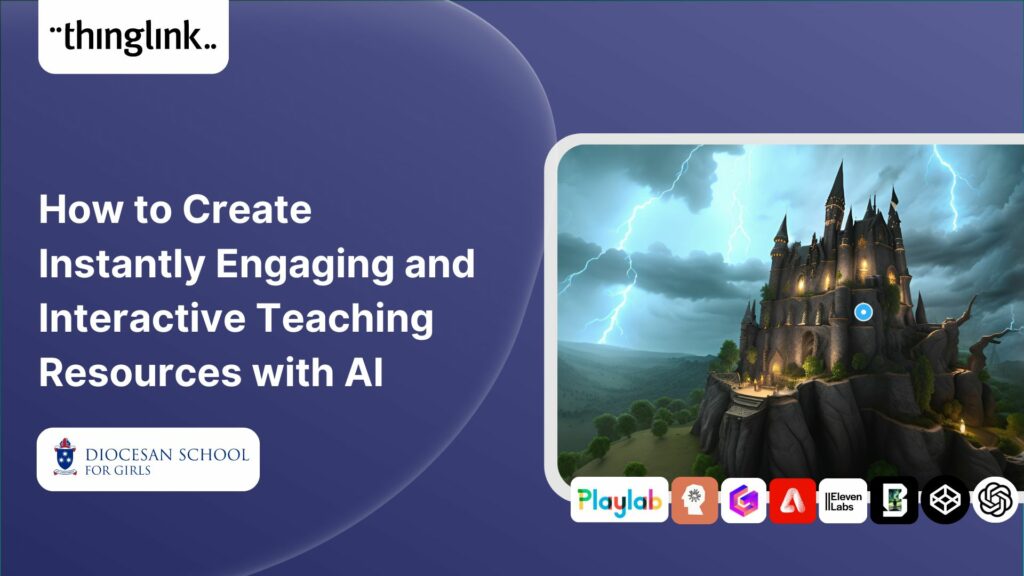
Rob McCrae is the AI Lead and ICT Director at Diocesan School for Girls in Auckland, New Zealand, an independent school of 1600 students aged 5-18. Earlier this...
Kyla Ball
5 min read
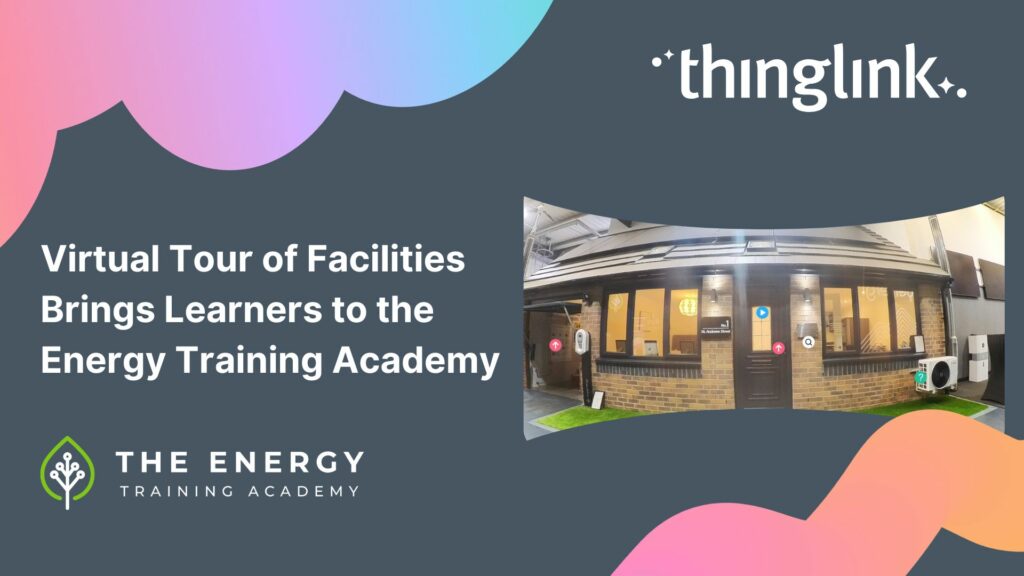
In this case study we explore how an innovative training provider is using ThingLink to help attract and develop the next generation of heating engineers ready ...
Kyla Ball
6 min read
Mitsubishi Electric was founded over a century ago and now has offices around the world. The first Mitsubishi Electric UK (MEUK) office opened in 1969 and since...
Kyla Ball
7 min read
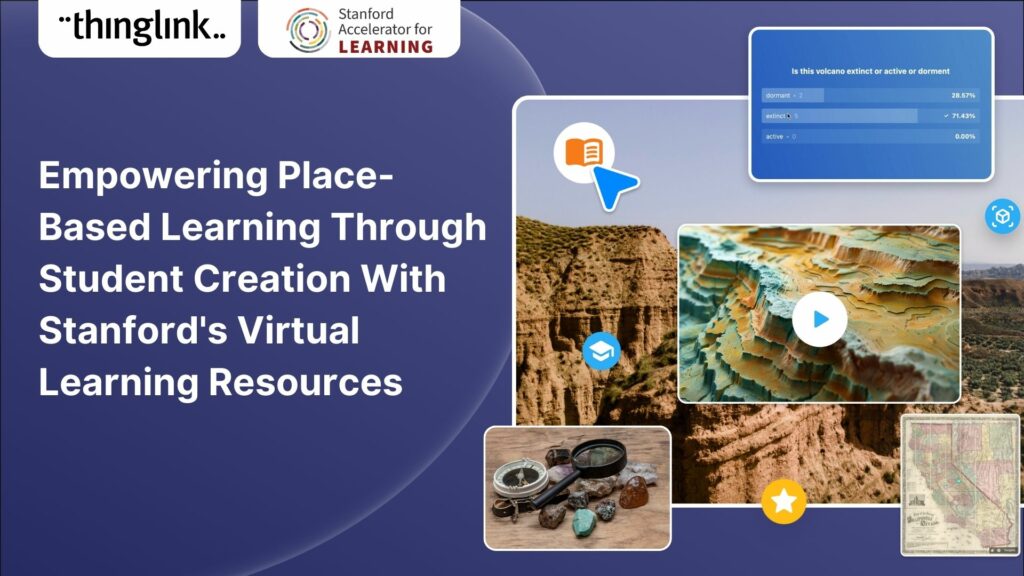
For educators looking to encourage student creation, Stanford University’s essential guide will show you how to use content from real-life Field Trips in ...
Kyla Ball
7 min read
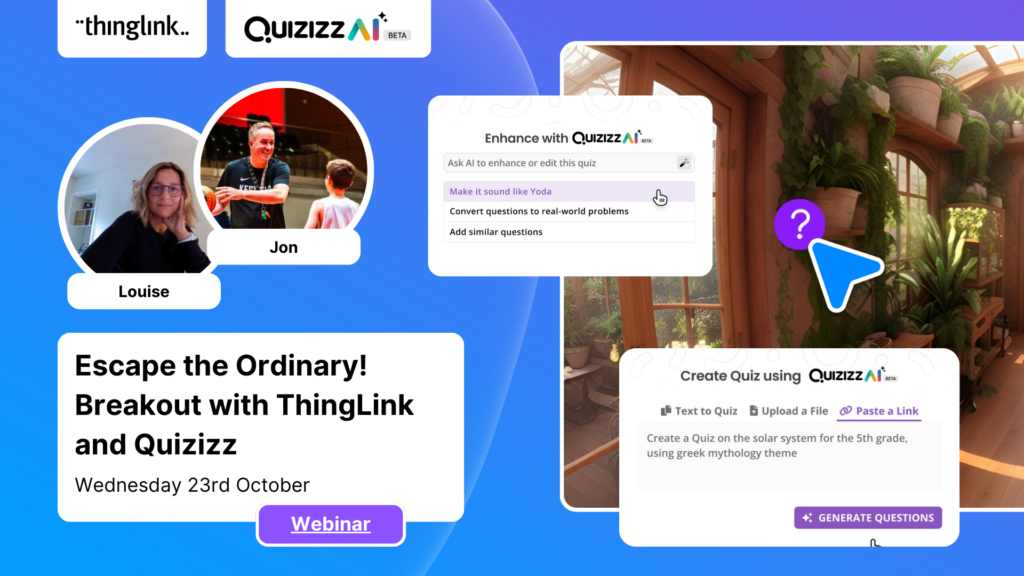
Escape the Ordinary! Breakout with ThingLink and Quizizz Immersive Escape Rooms and Breakouts can be very effective and engaging for all learners. Our past webinars...
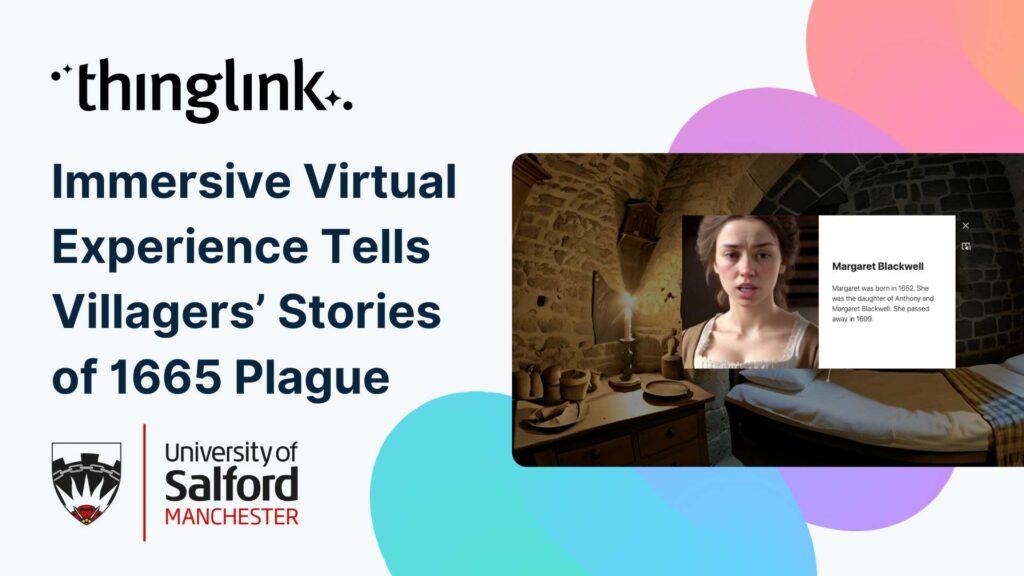
Immersive Virtual Experience Tells Villagers’ Stories of 1665 Plague A team at the University of Salford have created an immersive virtual experience of Eyam,...
Kyla Ball
3 min read
This post presents the background of how the The Weave RoomTM created an engaging, interactive and polished online training course with ThingLink, which was so ...
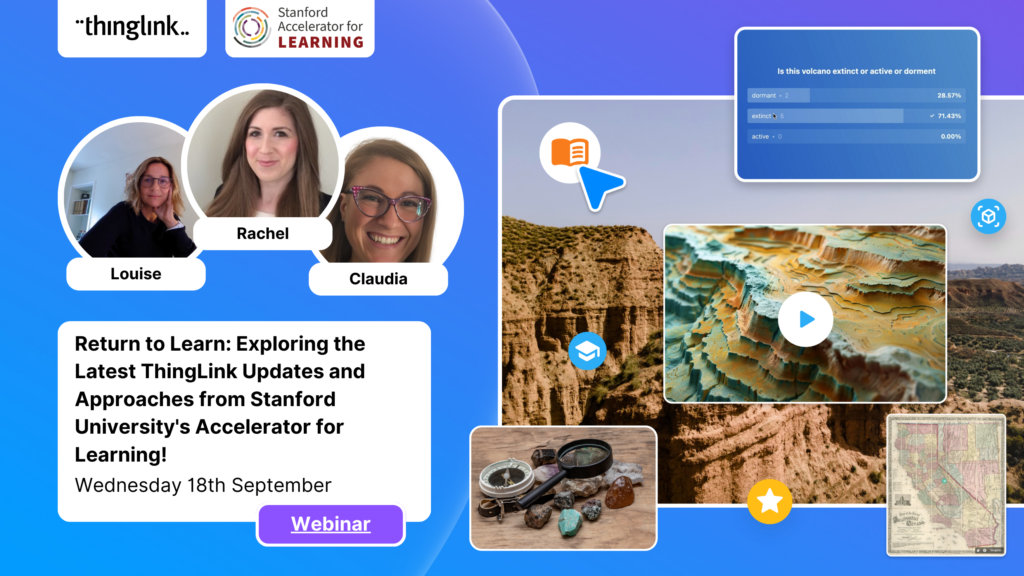
It’s that time of year for the FREE annual ‘Return to Learn’ webinar! Join us for an exciting and informative webinar as we present the latest ThingLink updates,...
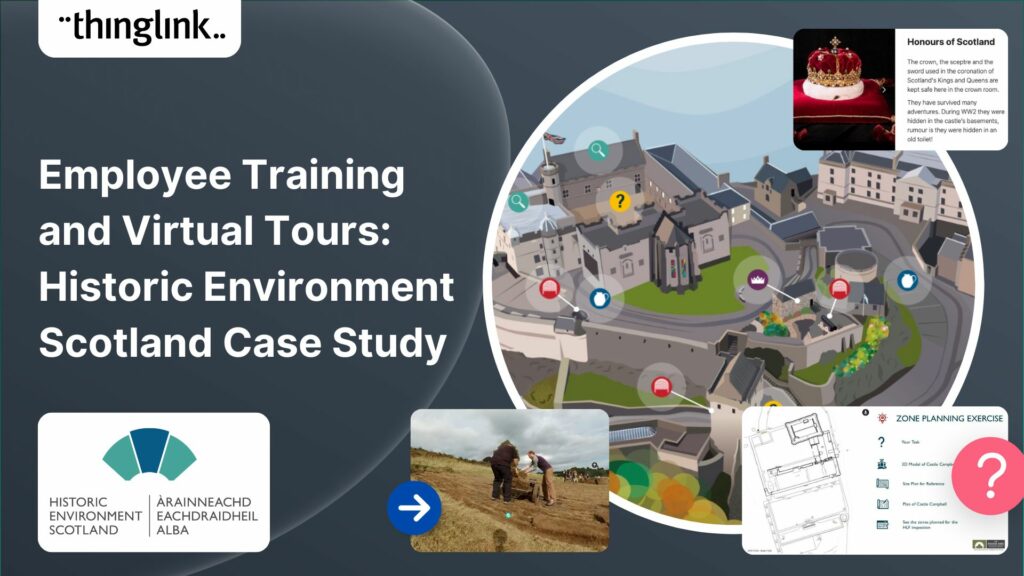
Caring for Scotland’s Heritage Historic Environment Scotland (HES) was formed in 2015 when Scottish Government agency Historic Scotland merged with the Royal ...
Kyla Ball
9 min read
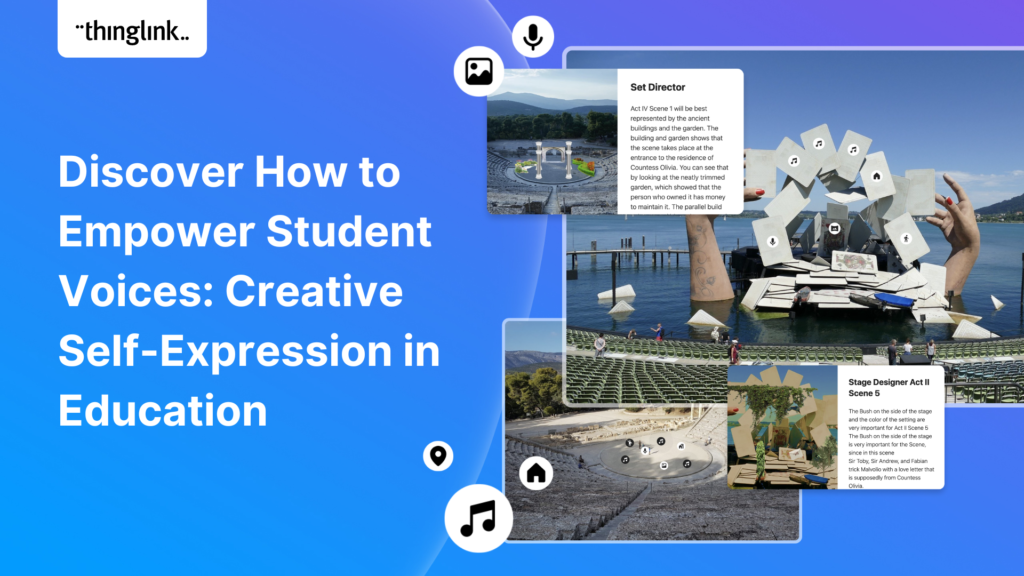
This case study features Rachel Silverman, a talented secondary English language arts teacher from Phormes Education in Germany. Rachel is a passionate advocate...