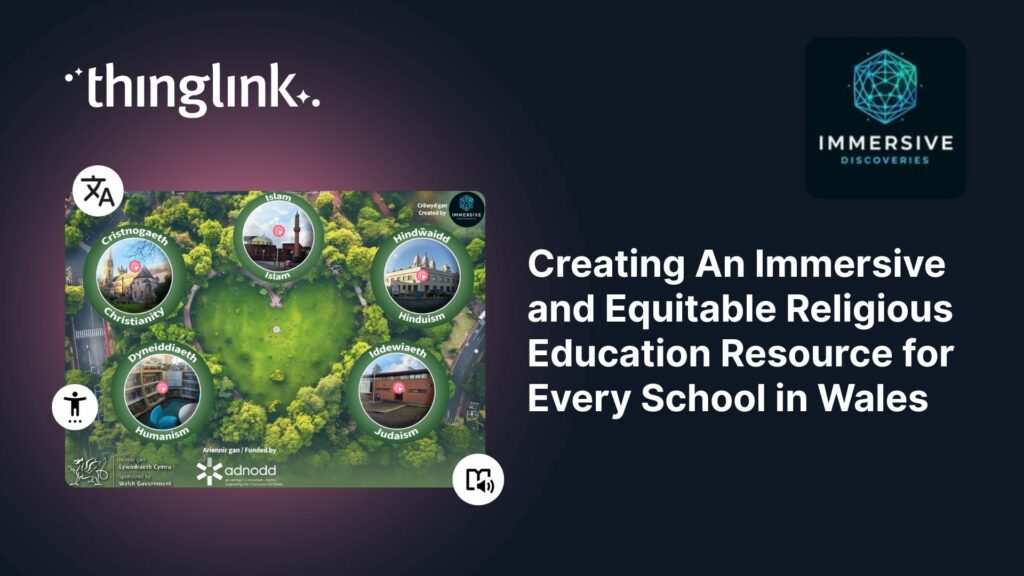
Educator Gemma Zeeman is founder of Immersive Discoveries, and a Qualified Teacher who has taught from Reception to Year 6. She currently works as a Research Assistant...
 Kyla Ball
8 min read
Kyla Ball
8 min read
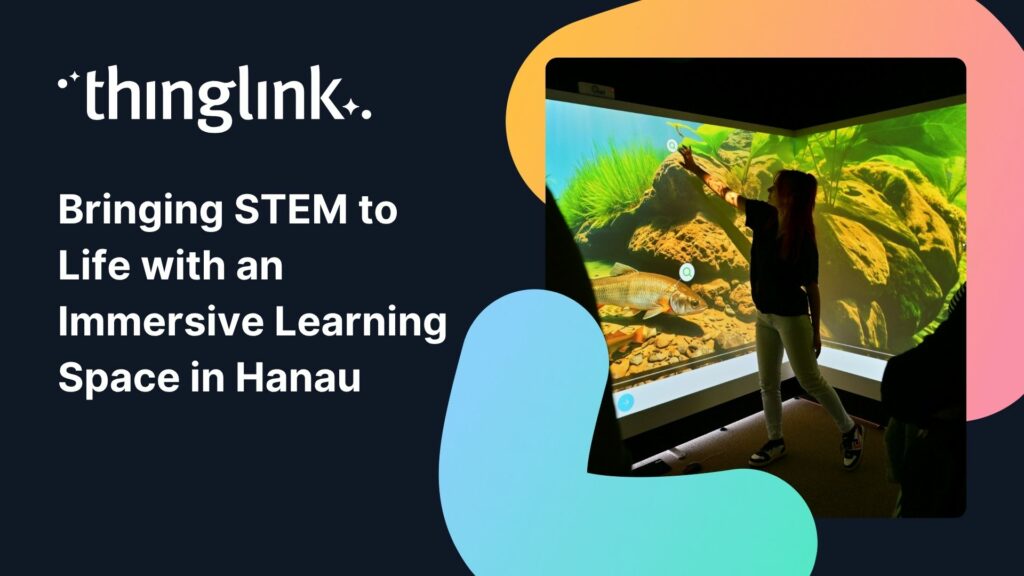
How Kathinka-Platzhoff-Stiftung used ThingLink to build an innovative STEM-focused immersive learning environment – and open it to the whole community. Location:...
Kyla Ball
4 min read
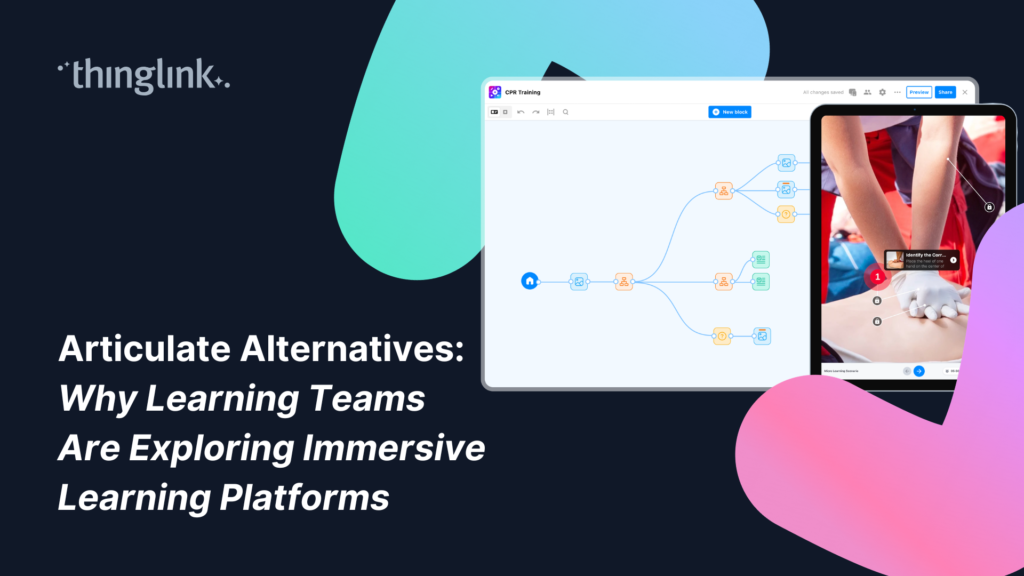
For more than a decade, Articulate has been one of the most widely used eLearning authoring platforms. Many organizations rely on tools like Articulate Storyline...
Haaste ISS Palveluiden CMS-yksikkö vastaa siivouksesta, kiinteistöhuollosta ja teknisistä palveluista Joensuun alueella. Business Joensuu hallinnoi Joensuun ...
Kyla Ball
3 min read
Challenge The CMS unit of ISS Palvelut is responsible for cleaning, property maintenance and technical services in the Joensuu region. Business Joensuu manages ...
Kyla Ball
4 min read
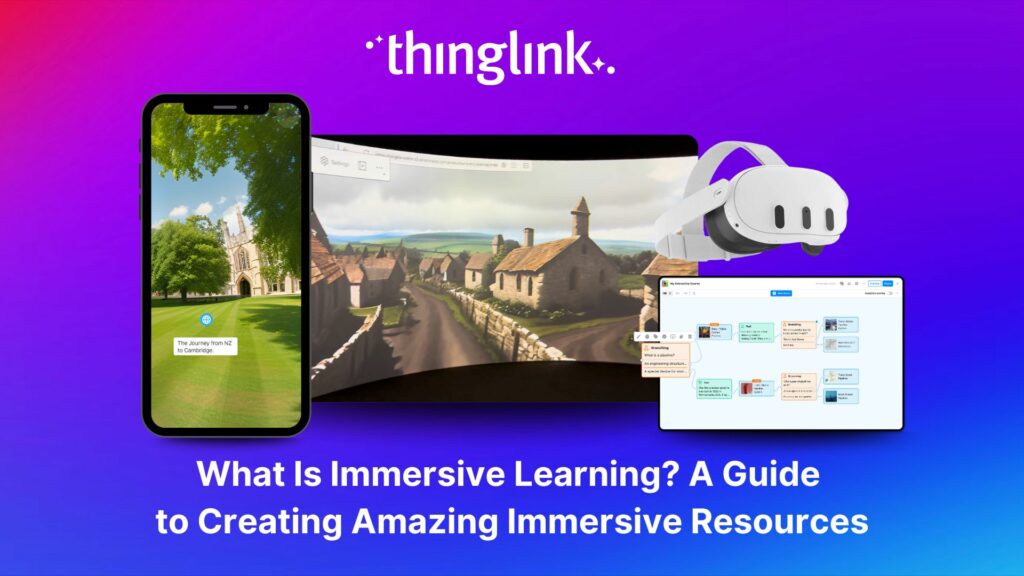
What is Immersive Learning? Immersive learning is a modern approach to education and training that uses interactive, spatial experiences to place learners in real-world...
Kyla Ball
6 min read
East Renfrewshire Council’s Education Department sought to improve how they delivered training, shared resources, and communicated with teachers across a diverse...
Kyla Ball
5 min read
The interactive media platform ThingLink now supports 3D model annotation. In addition to images and videos, ThingLink content creators can now also enhance 3D ...
Kyla Ball
2 min read
3D models are gaining popularity as the process of creating them has become more user-friendly. A few years ago you needed dedicated 3D modelling software, and ...
What is 3D Model Annotation? ThingLink allows users to create interactive 3D models as easily as they create interactive images, videos and virtual tours. The feature...
Kyla Ball
3 min read
Helsinki, 12 March 2026 ThingLink has entered into a strategic partnership with Vervenest Technologies Private Limited to support the expansion of immersive learning...
Your text becomes a part of your learning experience, create immersive, podcast-worthy audio every time. We’re excited to introduce a new audio narration feature...
Background: A Museum Lost to Flooding When catastrophic flooding occurred at the Roswell Museum in New Mexico in October 2024, the loss went far beyond physical...
Kyla Ball
6 min read
Protecting employee health and safety is one of the most fundamental responsibilities of any organization. Especially in high-risk industries, even a single incident...
Kyla Ball
6 min read
ThingLink’s powerful integration with Canva, the global visual communications platform, is now slicker than ever. You can now create and edit your base images...
Kyla Ball
5 min read
For students at Spesia vocational and special education college, ThingLink isn’t just a learning platform, but a tool for designing and building their own interactive...
Kyla Ball
5 min read
Background Tankespirerne (translated as “Thought Sprouts”) is a Danish educational consultancy led by Martin Kongshave, elementary school teacher and practitioner...
Kyla Ball
5 min read
Instructure is the global EdTech organization used by over 19 million unique users annually. It’s probably best-known as the home of Canvas, their flagship product...
Kyla Ball
5 min read
Transforming Education with Gamified Learning Experiences Education stands on the edge of a significant transformation, driven by innovative technologies that redefine...
Kyla Ball
5 min read
Are you ready to captivate your audience with an immersive, interactive experience? Digital escape rooms offer a unique way to engage, educate, and entertain your...
This teacher training resource for students on the PGCE course (Post Graduate Certificate in Education) demonstrates how ThingLink can be used to create interactive...
Kyla Ball
4 min read
An Introduction to 360° Photography for Beginners 360 degree images or photospheres capture the entire surrounding environment in a single shot, allowing viewers...
For many higher and further education institutions, the integration of new technologies like AV equipment often presents a double-edged sword. While advancements...
Kyla Ball
6 min read
Plans for Every Educator and Every Institution We’ve listened to educators about what they need from their ThingLink plans for their students, school districts,...
Nutrition and dietetics higher education programs face a critical challenge common across healthcare studies: effectively connecting theoretical knowledge with ...
Kyla Ball
9 min read
Looking for an easy way to create immersive 360° virtual tours or virtual expeditions that work seamlessly in Virtual Reality (VR)? ThingLink is the ultimate all-in-one...
How can marketers truly attract and engage consumers in the saturated world of digital marketing? Attention is hard to earn and easy to lose. Audiences want something...
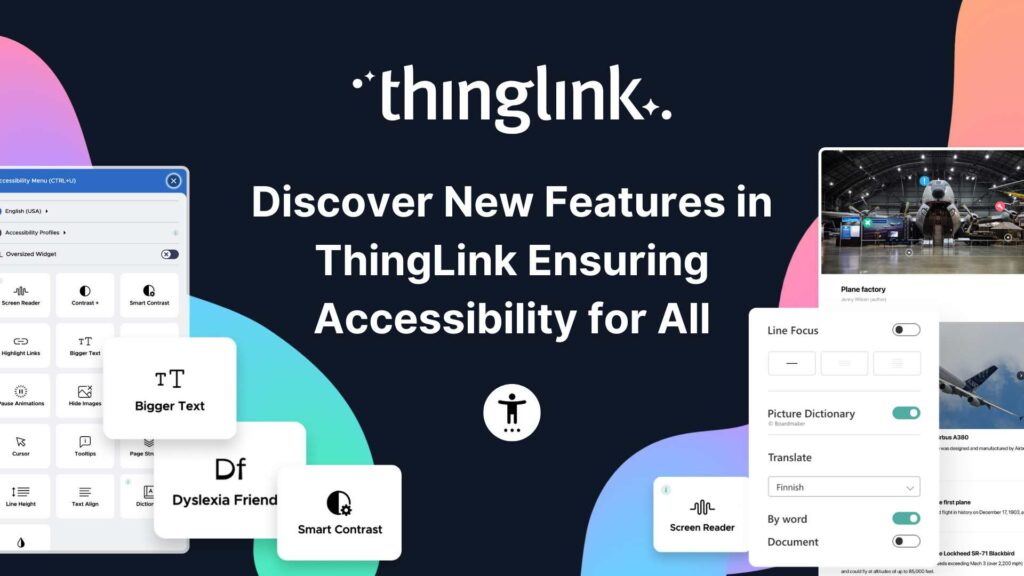
Creating accessible learning experiences is critical for educators, trainers and student creators, but it need not be daunting! ThingLink is a platform that allows...
¿Alguna vez has deseado llevar a toda tu clase a la selva amazónica, a la superficie de Marte o a los pasillos del Louvre o del Smithsonian… todo antes del ...
 Joseph Mayo
4 min read
Joseph Mayo
4 min read
Ever wished you could take your entire class to the Amazon rainforest, the surface of Mars, or the halls of the Louvre or the Smithsonian… all before lunch? ...
Joseph Mayo
4 min read
A medida que el aprendizaje inmersivo continúa transformando las aulas en todo el mundo, cada vez más escuelas y universidades están comenzando a explorar el...
Para que tu camino en la creación de contenido educativo en XR sea lo más sencillo posible, hemos seleccionado una colección de recursos gratuitos que te ayudarán...
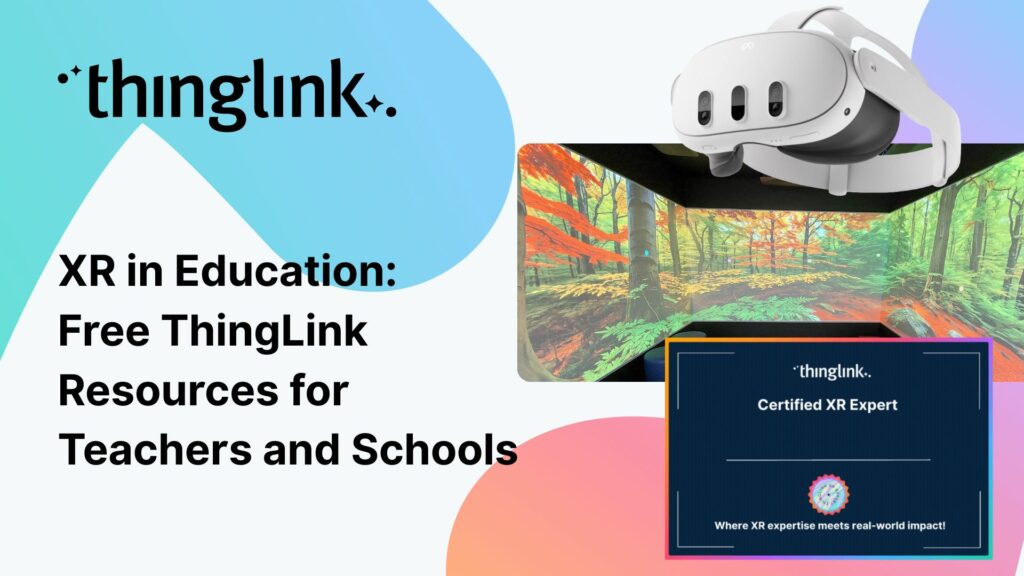
To make your journey through XR learning content creation as easy as possible, we’ve curated a collection of free resources that will help get you started. Packed...
As immersive learning continues to transform classrooms around the world, more schools and colleges are beginning to explore the potential of Meta Quest headsets...
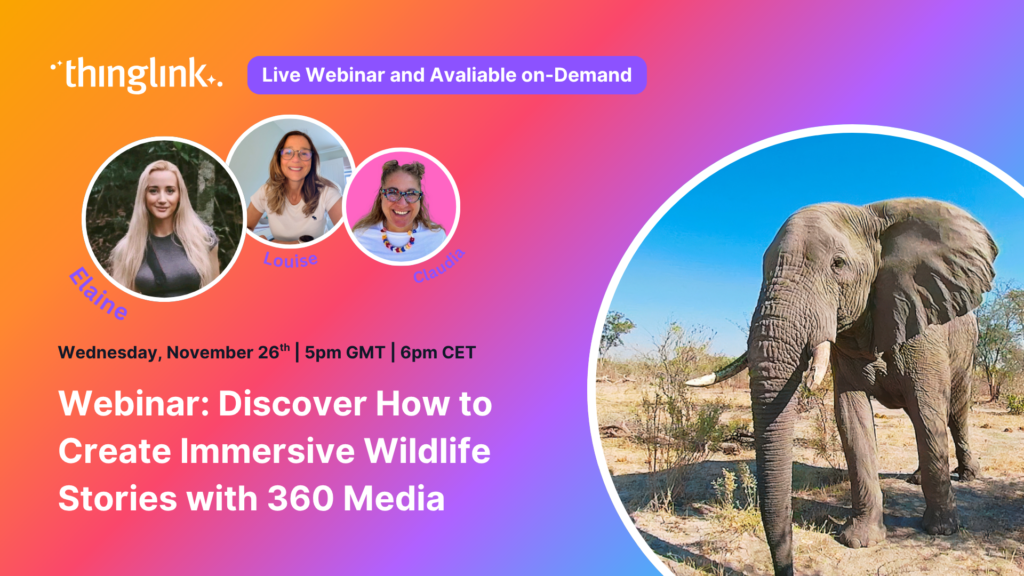
🐘 Inspire young minds to explore, protect and connect with nature using immersive storytelling, 360° content and ThingLink’s creative tools. Join us for an...
ThingLink has recently made available an inspiring set of three conservation-based 360° videos, designed for learners, educators, and anyone curious about how ...
Kyla Ball
4 min read
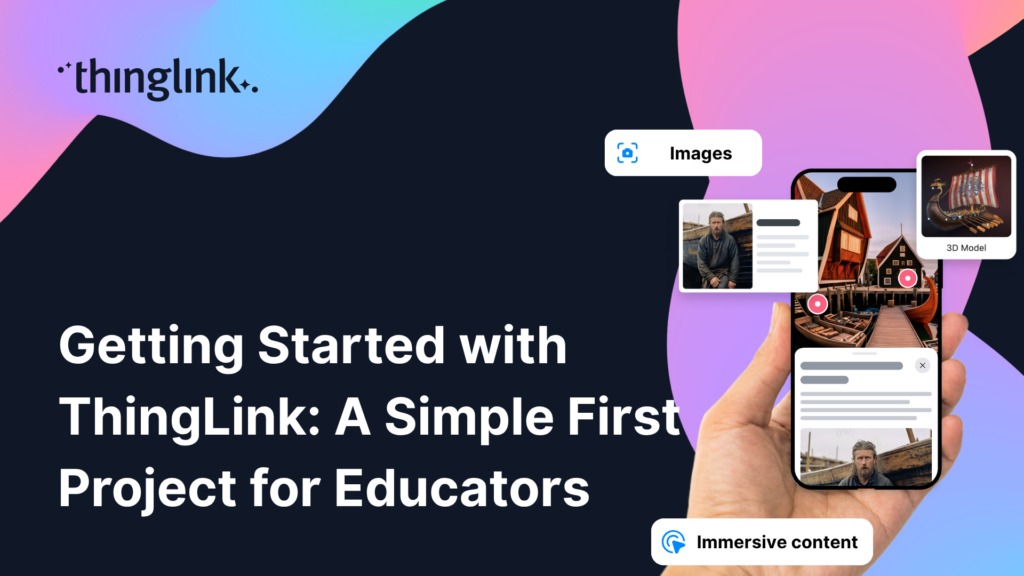
ThingLink is a fantastic tool for creating interactive and immersive images, videos, and virtual tours. It allows you to bring visuals to life by adding hotspots,...
Customer education is core to marketing, not a separate tactic. It can be as simple as helping customers learn that your brand or product exists, or as deep as ...
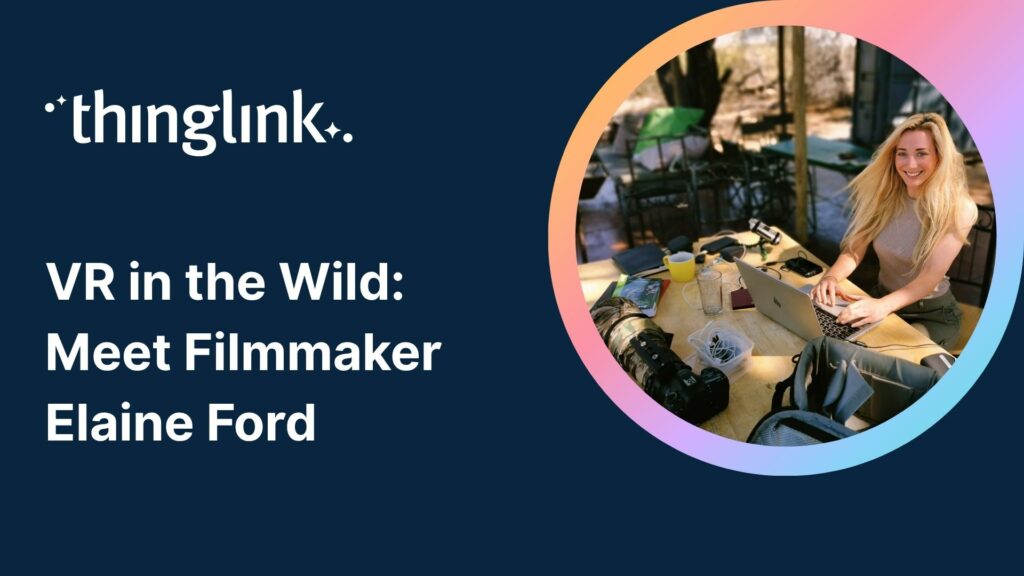
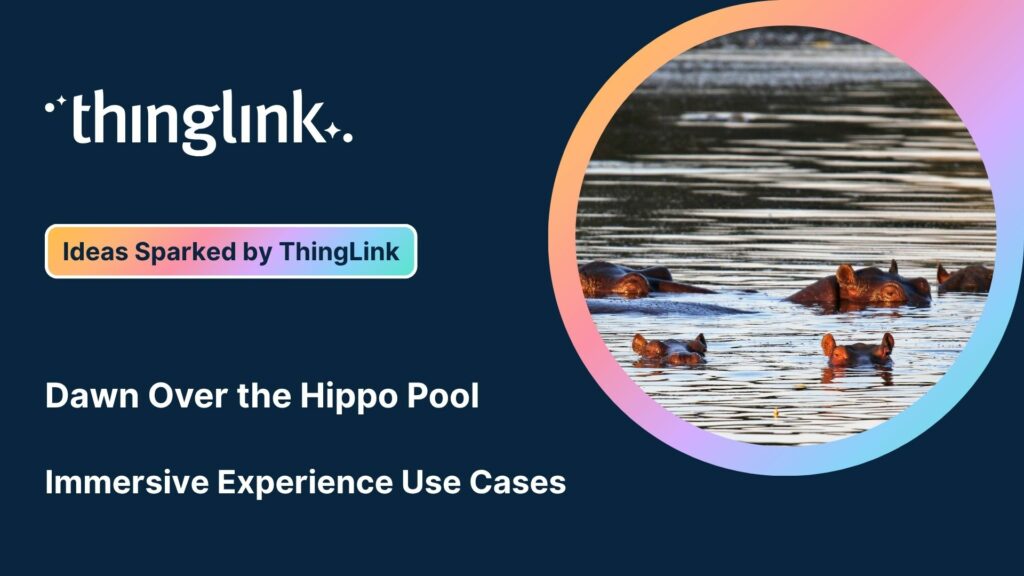
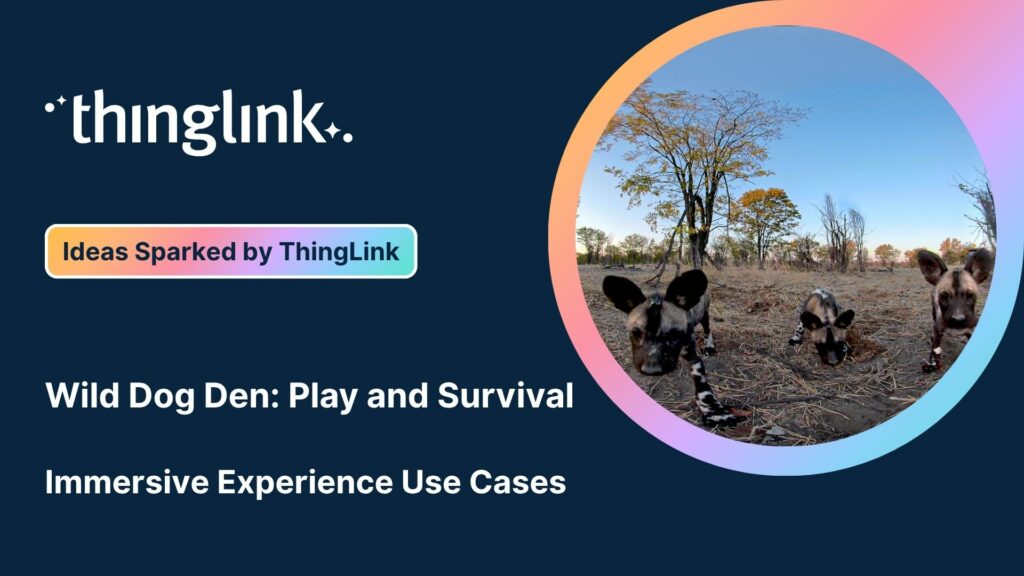
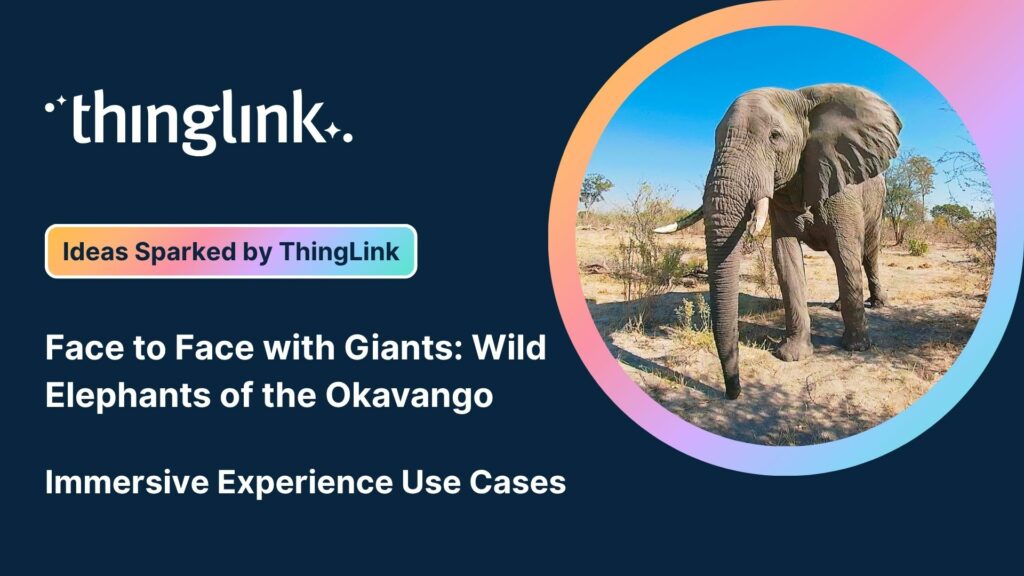
We’re delighted to collaborate with Elaine Ford to bring you a truly unique collection of 360° video footage captured in the wild. These immersive scenes offer...
We’re delighted to collaborate with Elaine Ford to bring you a truly unique collection of 360° video footage captured in the wild. These immersive scenes offer...
We’re delighted to collaborate with Elaine Ford to bring you a truly unique collection of 360° video footage captured in the wild. These immersive scenes offer...
When creating any visual content for your business, it’s vital that your brand is reflected properly throughout the work. That goes for any content you create...
Are marketers a type of educator? As the Marketing Manager here at ThingLink, I’ve been pondering this question after I recently told one of my colleagues, “I...
 Louise Jones
11 min read
Louise Jones
11 min read
At Hackbridge Primary, the introduction of ThingLink has transformed teaching and learning in a range of ways. In just a year, staff have seen shifts in how pupils...
Kyla Ball
5 min read
Museums and heritage organizations have always faced the challenge of making their collections both accessible and engaging, while also safeguarding them for future...
Kyla Ball
5 min read
We believe immersive learning should be within reach for everyone, not just large organizations and institutions. That’s why ThingLink’s new Creator plans are...
Flexible monthly subscriptions now make it easier for cultural institutions to bring collections and exhibitions to life with interactive tours and spatial storytelling....
Kyla Ball
3 min read
The New ThingLink Creator Plans are available as flexible monthly subscriptions, widening access for creators, trainers, and educators worldwide. Today, ThingLink...
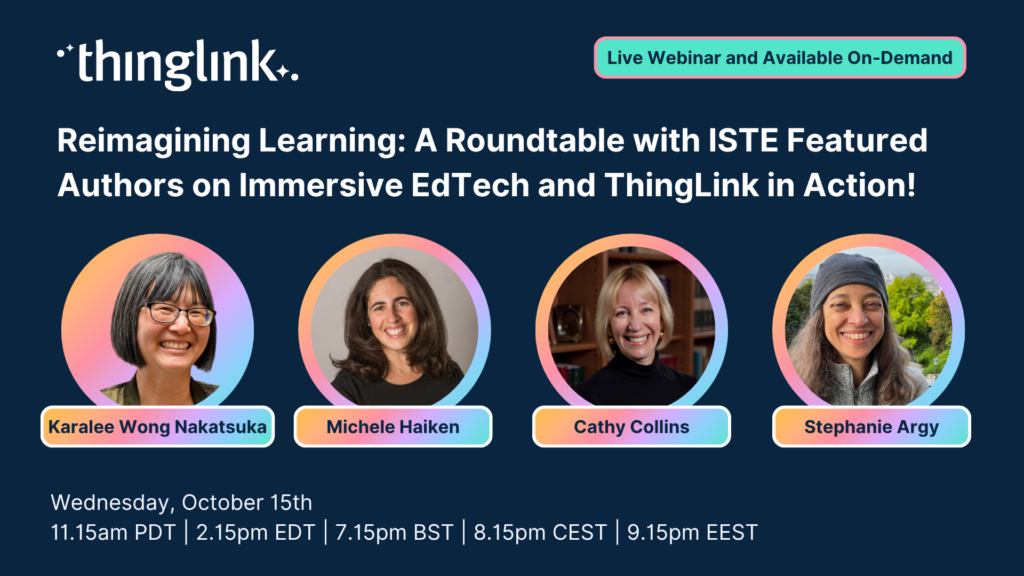
Webinar: Reimagining Learning: A Roundtable with ISTE Authors on Immersive EdTech and ThingLink in Action! ✨ Featuring ISTE Recognised Authors: Karalee ...
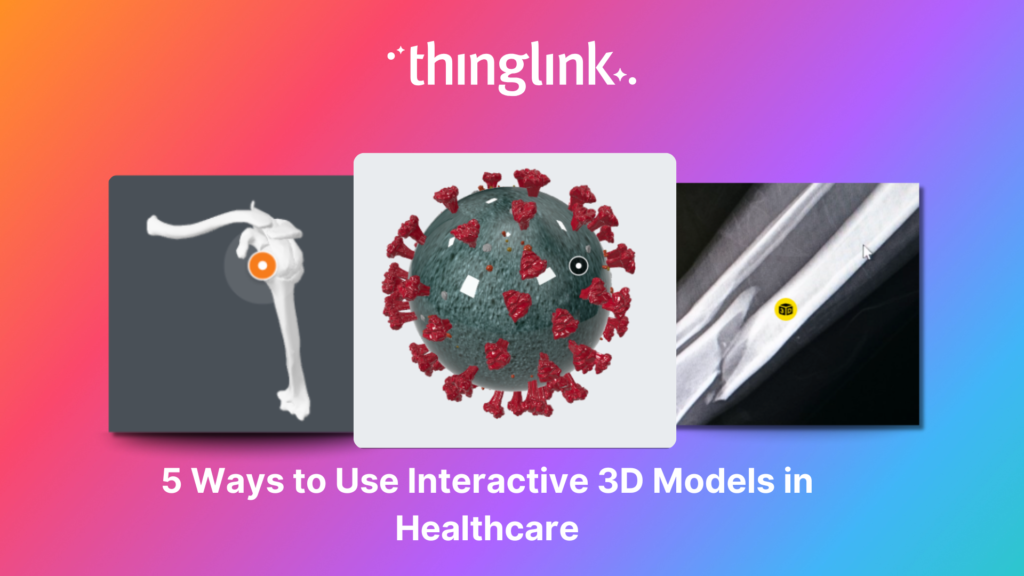
As technology continues to advance, virtual reality, augmented reality and 3D models are becoming much more commonplace across all industries, particularly healthcare. ...
Education Special | From Cupboard to Classroom: Getting the most out of your VR Headsets! Have a set of VR headsets sitting in the cupboard, barely touched since...
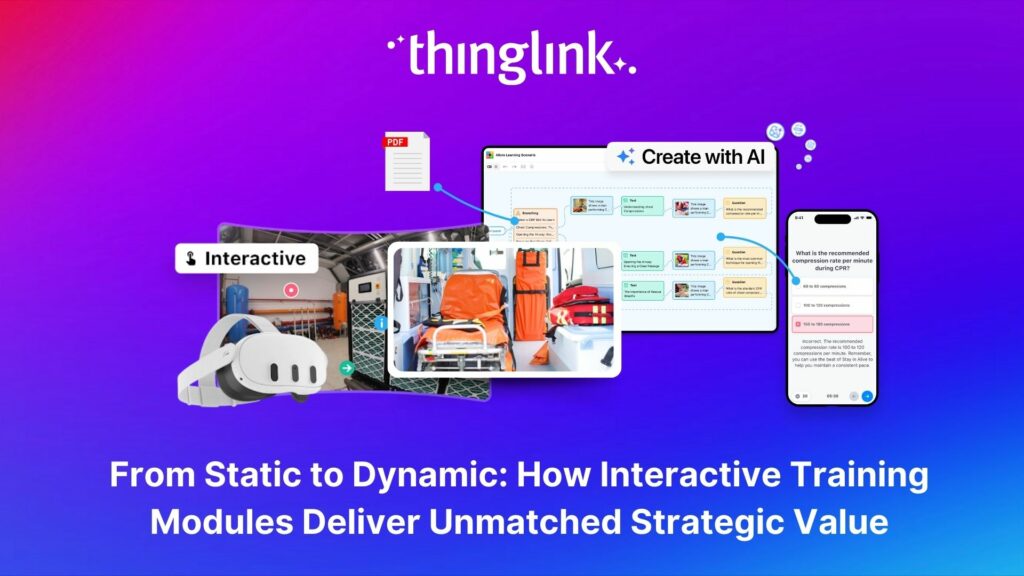
As organizations continue to invest in digital learning, awareness and demand for immersive learning experiences in employee training are at an all-time high. Traditional...
Kyla Ball
6 min read
Creating Interactive Simulations for Real-World Readiness: Immersive Learning for Medical Schools & Healthcare Teams Where and When 📅 Date: Now On-Demand...
LEO, a forward-thinking British multi-academy trust, has pioneered a structured, pedagogy-first approach to digital learning that has driven significant gains in...
Louise Jones
10 min read
New Caney Independent School District (ISD) added ThingLink to their roster of online learning resources in 2020 and it soon became a valuable tool with many applications....
At ThingLink, our mission is to empower educators, trainers, and content creators to build truly impactful digital learning experiences. We believe that great learning...
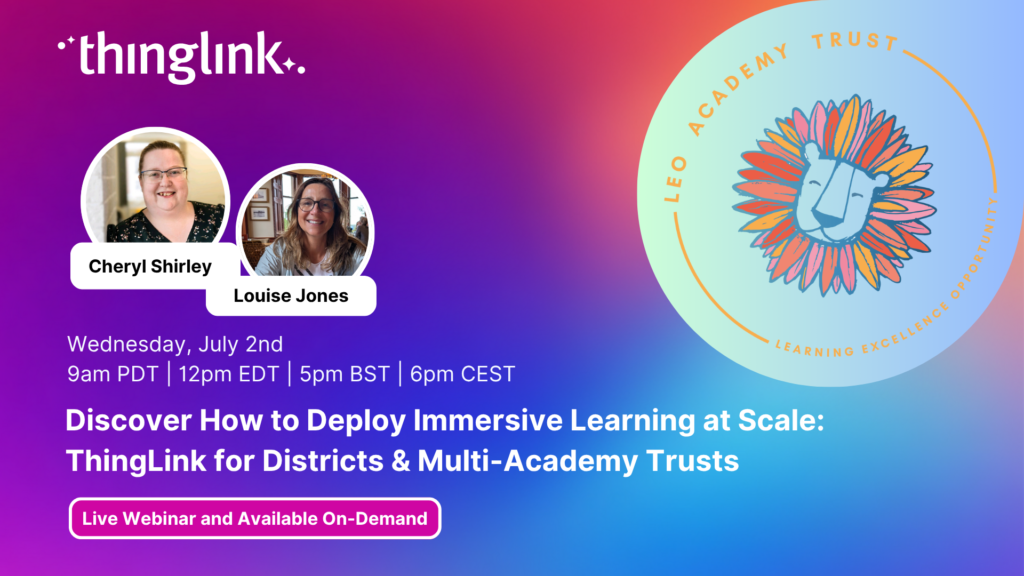
Solve System-Wide Challenges with Easy Creation, XR/VR Integration & Interactive Content Join Louise, ThingLink and Cheryl Shirley, Director of Digital Learning...
The other day I was watching my close friend’s seven-year-old son do something that completely stopped me in my tracks (if you’ll excuse the pun). Nico...
The foundations of ThingLink are rooted in the socio-cultural theory of learning developed by Lev Vygotsky. My own journey began in 2003 at the Center for Activity...
The global workforce is constantly evolving, which means that the strategies that companies use to attract and retain top talent have to evolve to keep pace. As...
Kyla Ball
5 min read
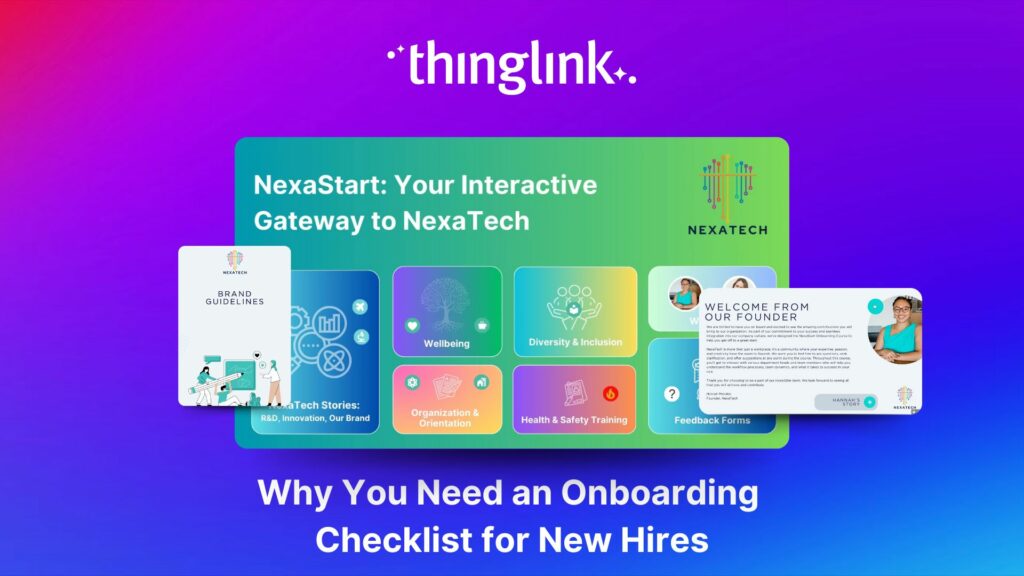
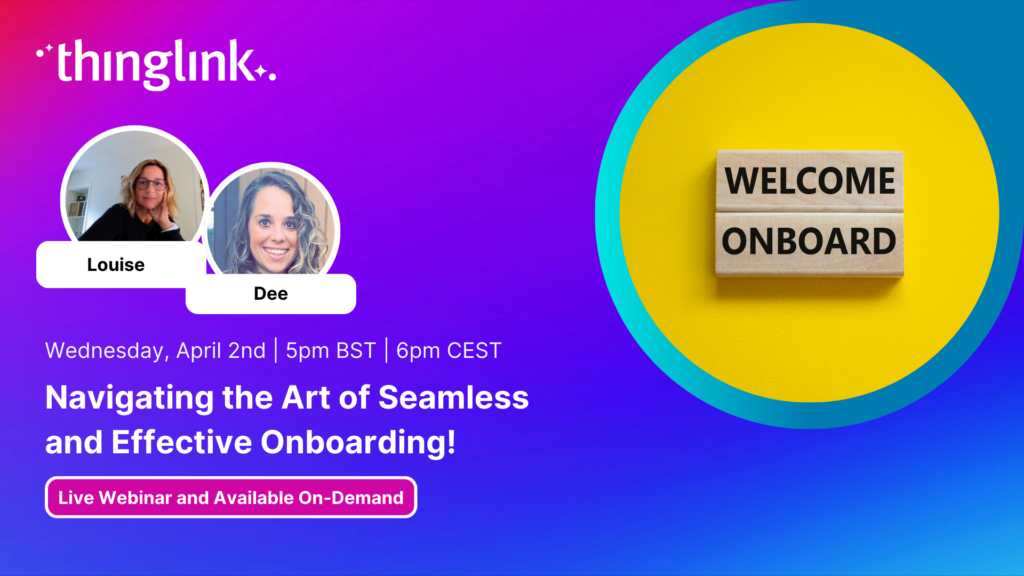
Welcoming a new employee should be an exciting time for any organization — but without a clear onboarding checklist, it can quickly become overwhelming for both...
Kyla Ball
5 min read
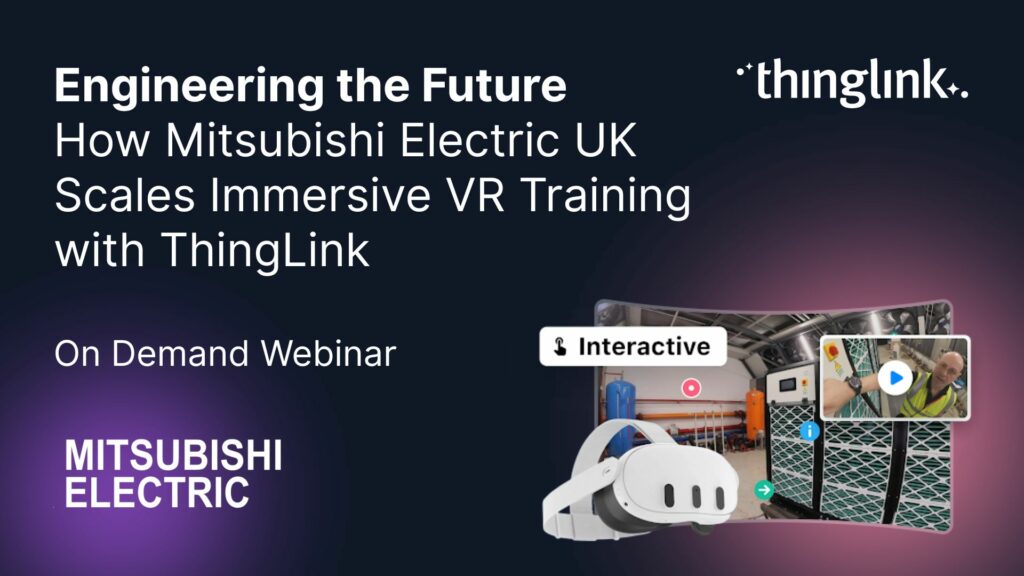
How Mitsubishi Electric UK Scales Immersive VR Training with ThingLink Securing the Next Generation of Engineers: How Mitsubishi Electric is Solving the Talent ...
Turn Summer Experiences into Story-Driven Learning: How Students Can Capture and Reflect using Immersive Journals Make it a Summer to Remember Join Louise Jones...
Over the last decade, mixed reality experiences using immersive technology have become increasingly commonplace throughout museums and art galleries worldwide. ...
Kyla Ball
5 min read
Whether bringing new hires up to speed or developing existing talent, an immersive approach to onboarding and upskilling delivers more engaging, memorable and scalable...
Kyla Ball
9 min read
Stockholm, April 8th, 2025 – ThingLink, the leading platform for creating and sharing immersive learning experiences across platforms and devices, is now available...
Immersive learning technologies like ThingLink are transforming education! Research shows they improve engagement, comprehension, and knowledge retention—making...
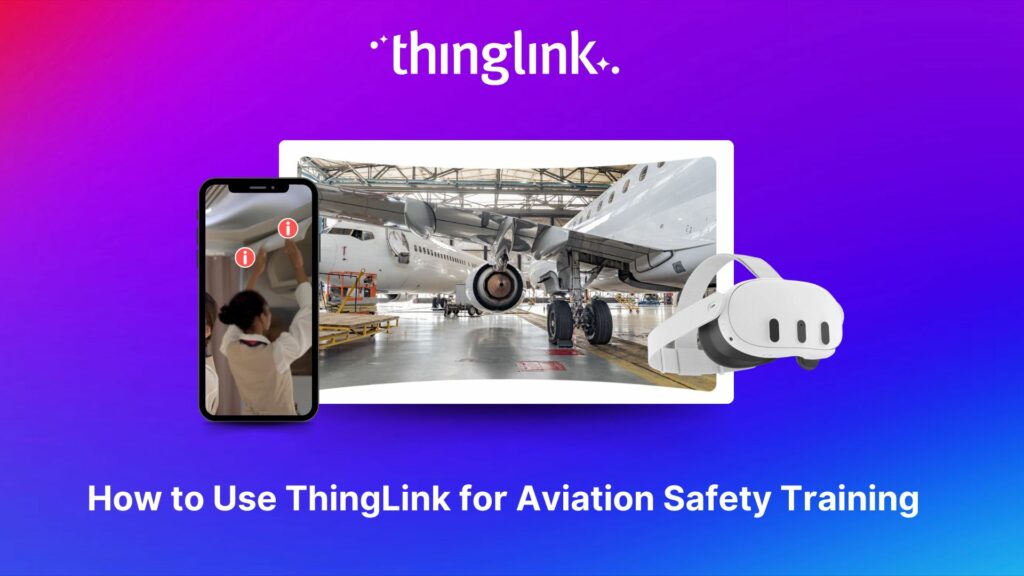
The high-stakes nature of aviation safety demands effective and engaging training methods. Traditional employee training approaches such as instructor-led training...
Kyla Ball
5 min read
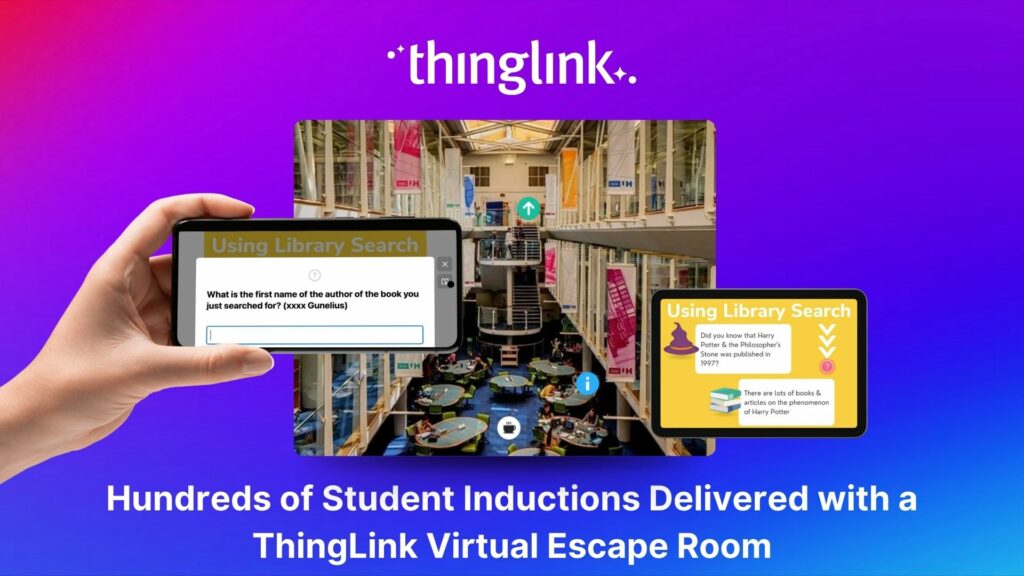
Louise Conway, Information Manager at the University of Hertfordshire (UK) has created an ingenious, engaging virtual escape room to ensure that new students are...
Kyla Ball
7 min read
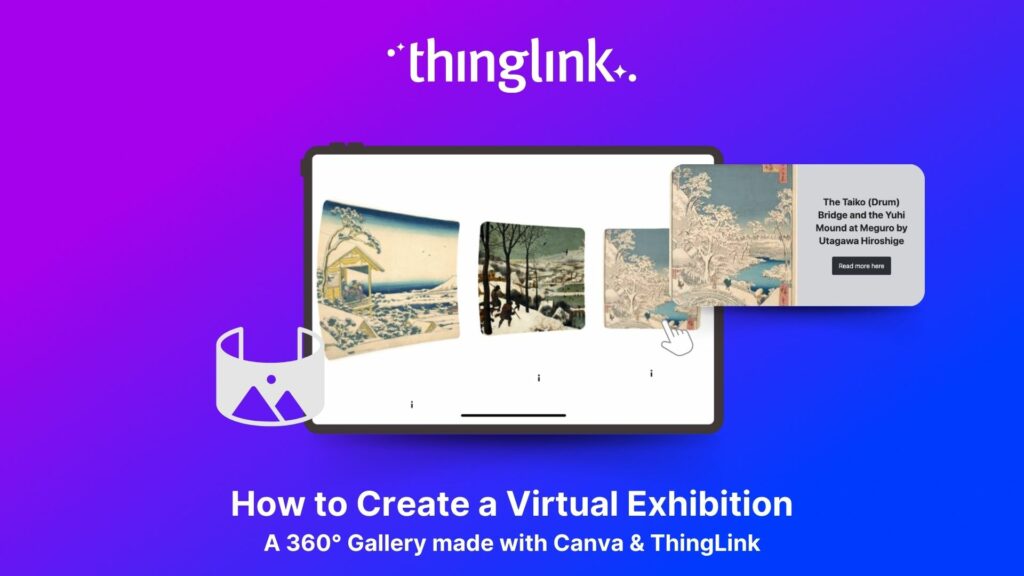
We show you how to make your own interactive 360° virtual art gallery with our Canva template and ThingLink The ThingLink Team have devised a quick and easy way...
Kyla Ball
4 min read
The human and financial costs associated with an accident at work are potentially catastrophic for any business, both in the immediate term and in terms of reputational...
Kyla Ball
11 min read
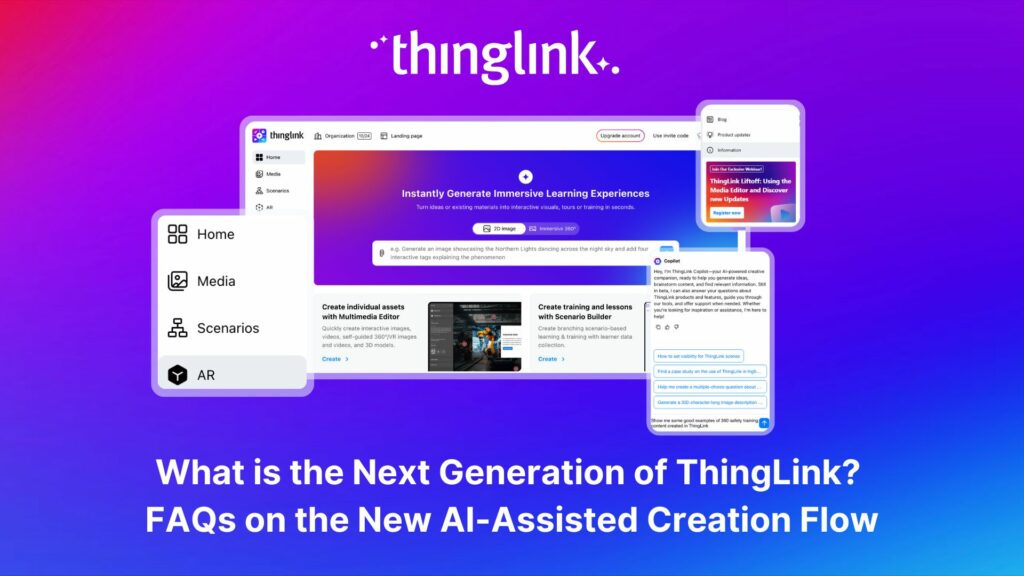
The next generation of ThingLink has launched, with the same easy-to-use immersive learning creation tools now accessible via a fresh new interface. Create interactive...
Kyla Ball
4 min read
💡 Did you know that organizations with a strong onboarding process improve new hire retention by 81% and productivity by over 50%?!* The days before and at the...
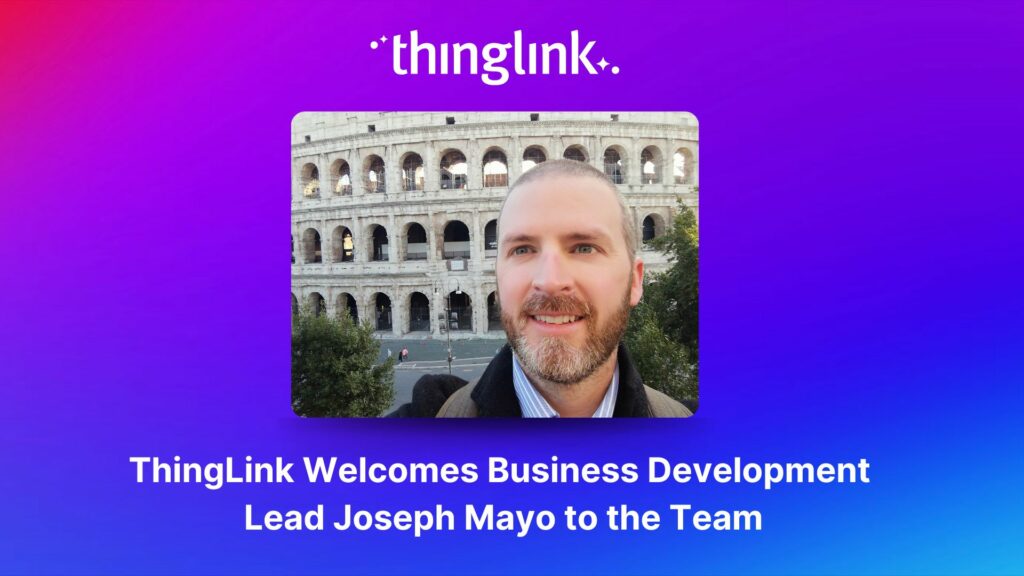
ThingLink, the AI-assisted immersive content creation platform for training and education, continues to grow its global team alongside the expansion and development...
Spring into Immersive Learning! 🌱 Join your hosts Louise and Claudia for a playful and engaging session on the rise of immersive learning! We’ll explore new...
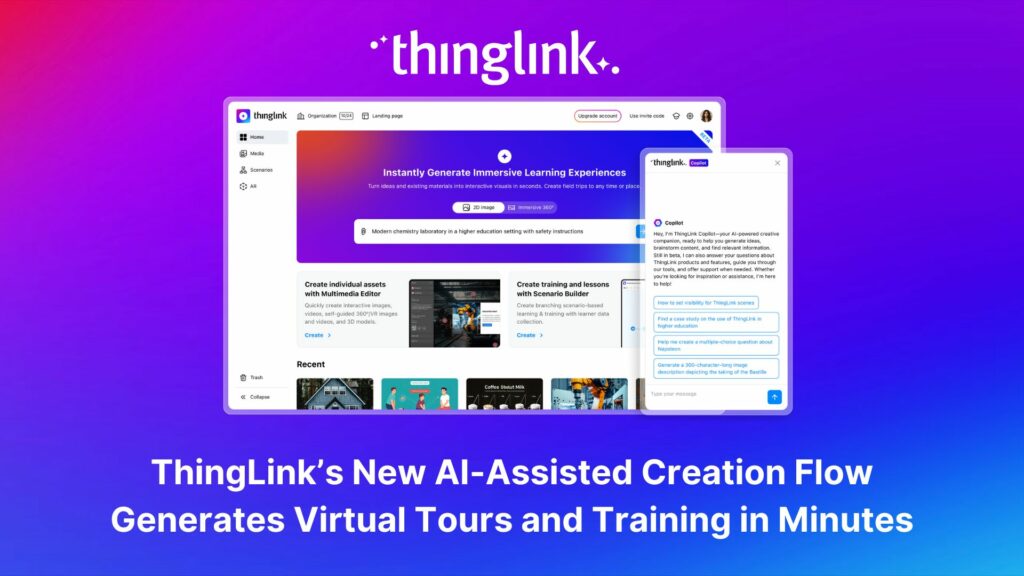
As digital transformation accelerates across industries, the demand for intuitive AI tools that empower non-technical users to create sophisticated learning experiences...
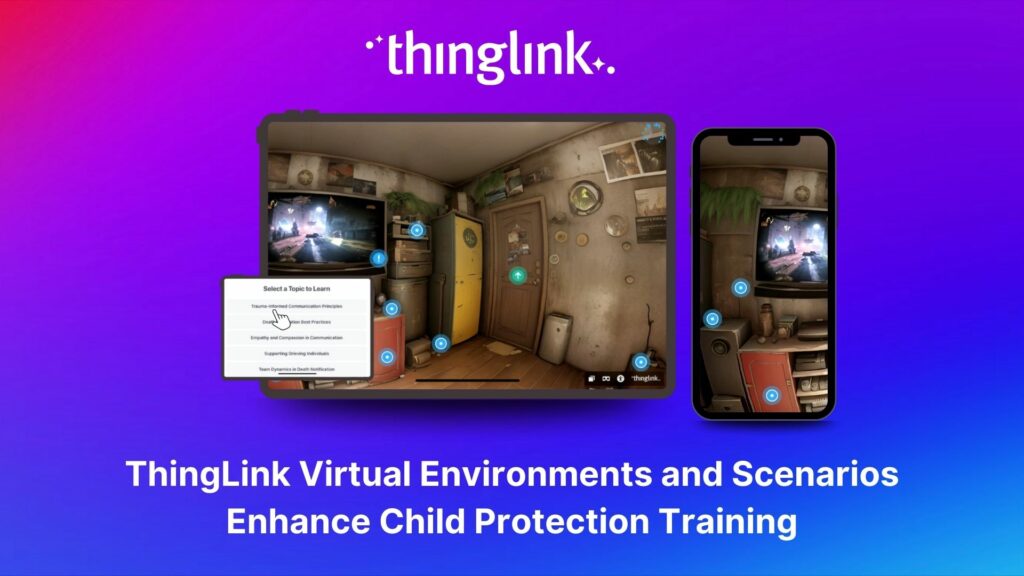
Background Zero Abuse Project (founded in 2018) is a non-profit organization based in the US. Their mission is “To protect children from abuse and sexual assault,...
Kyla Ball
8 min read
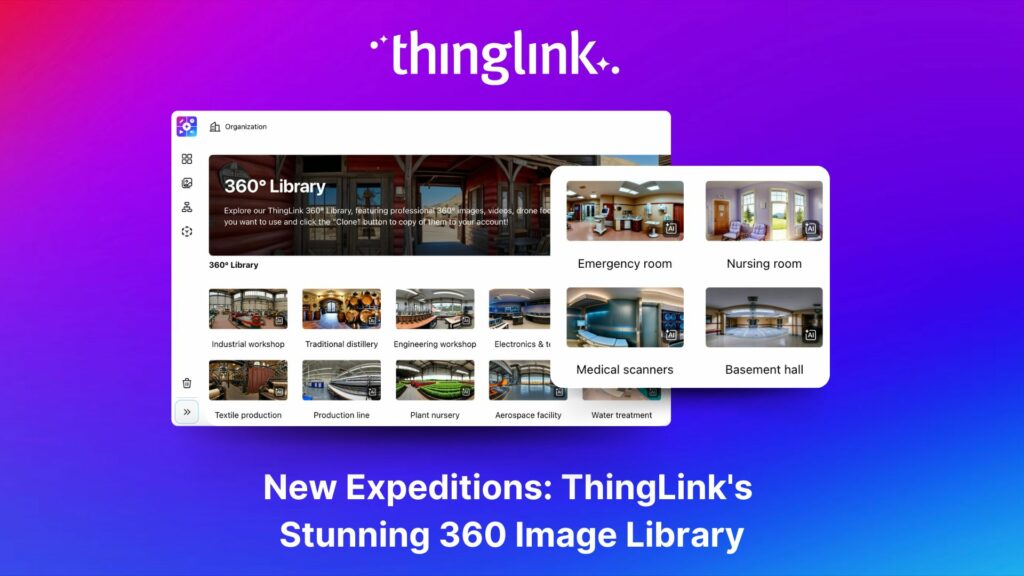
ThingLink’s 360 Image Library is a curated collection of professional 360 images from culturally relevant natural and historic sites. You can use the images...
Kyla Ball
4 min read
As the modern workforce evolves, creating employee training programs that are engaging, impactful, and scalable has been a growing challenge for organizations. ...
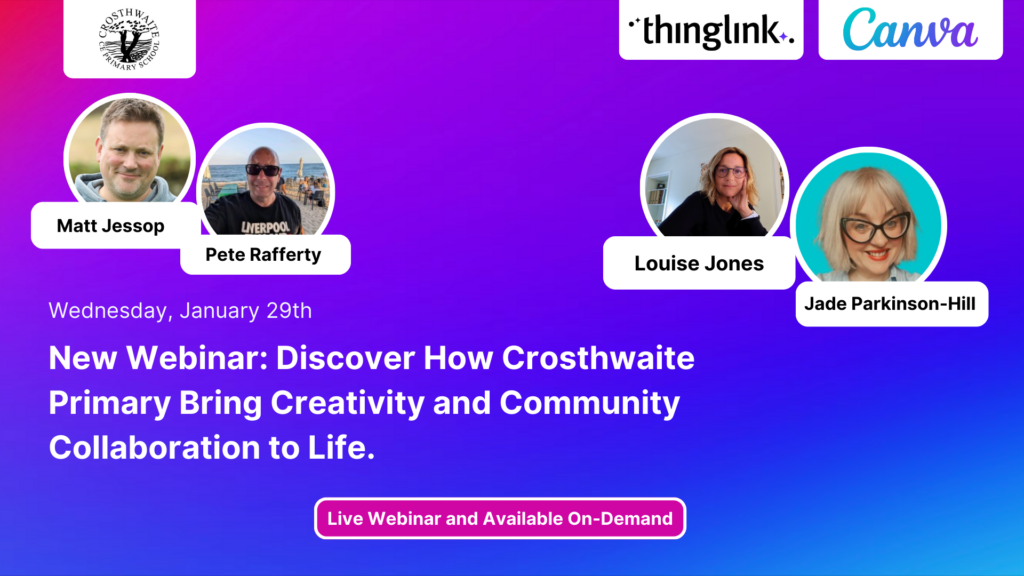
Join us for an inspiring and practical webinar where Crosthwaite Primary School share how they’ve designed their curriculum to foster creativity, community collaboration,...
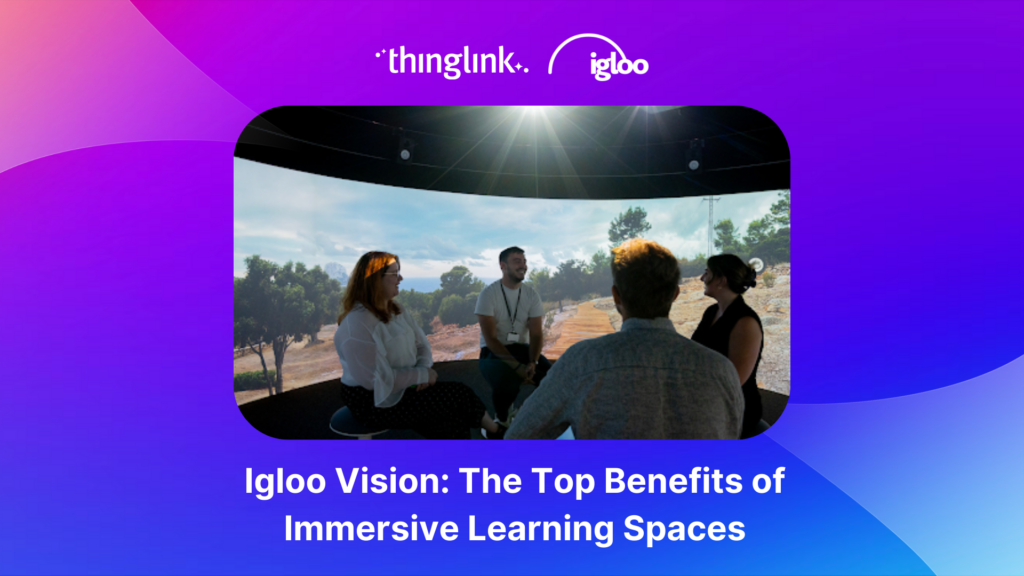
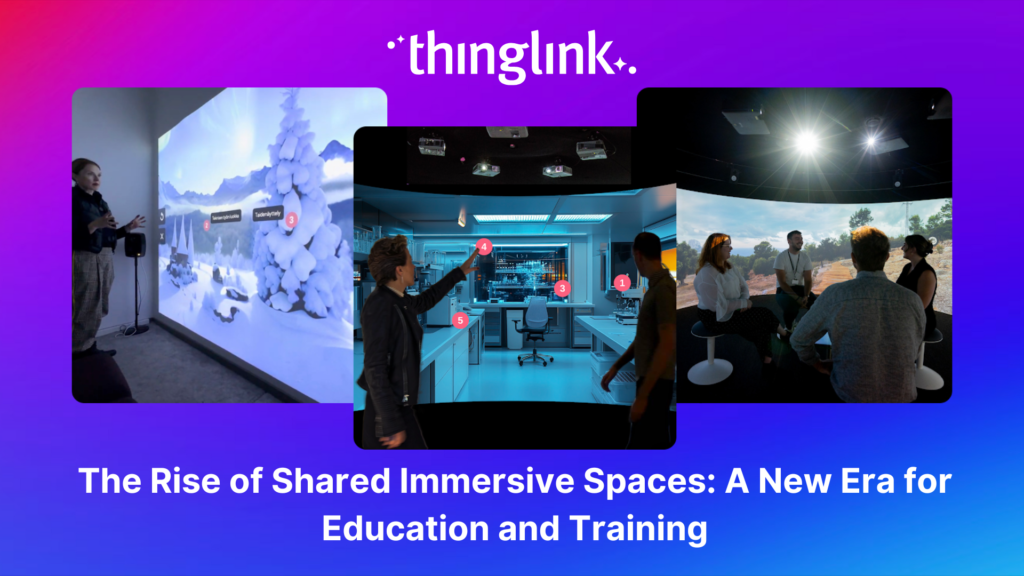
The increasing interest and adoption of shared immersive spaces in recent years reflects a shift in the way we see the future of learning, future of education, ...
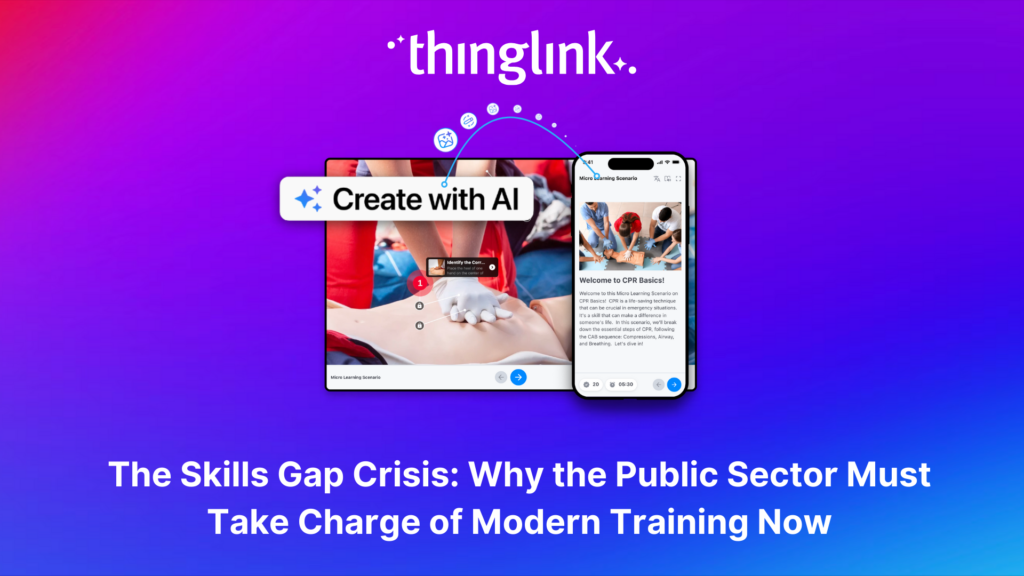
The world of work is evolving faster than ever, transforming industries and creating new demands on the workforce. While the private sector and higher education...
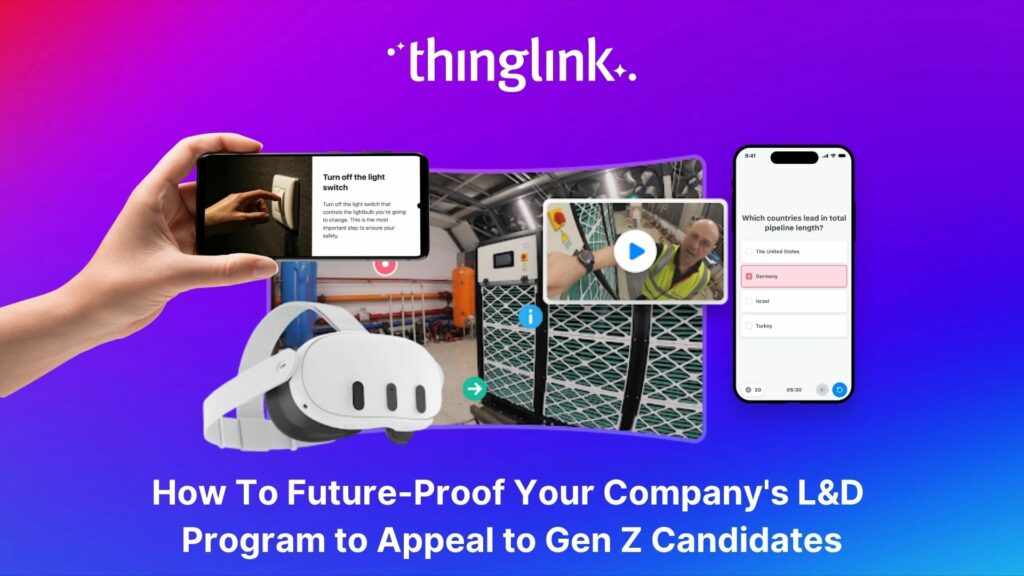
As organizations transition from a Generation X-dominated workforce to one led by Millennials and Generation Z, the need to modernize training programs has become...
Join us for an unmissable webinar celebrating a year of innovations with ThingLink! 🌟 We are excited to invite you to discover all the incredible updates we’ve...
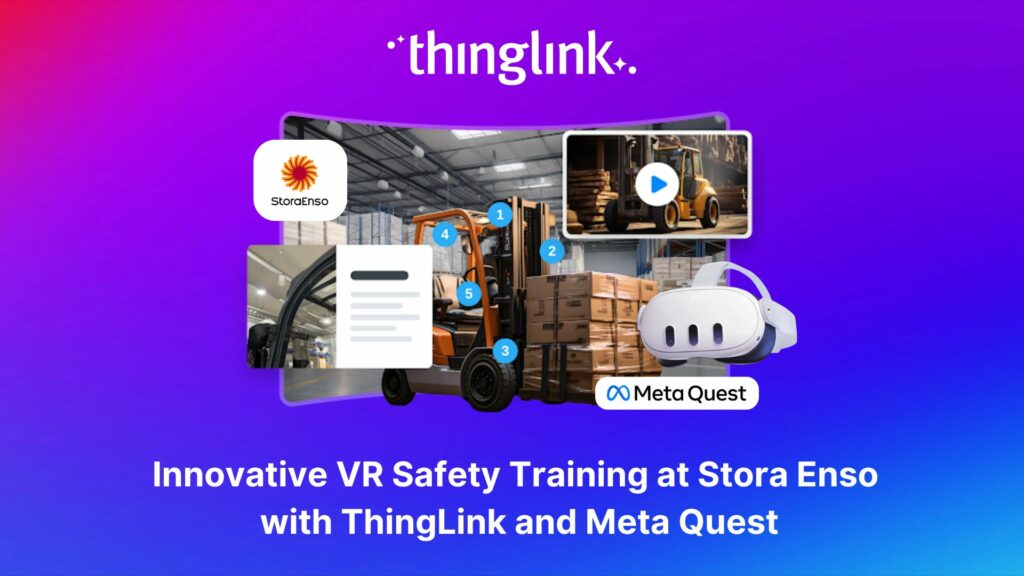
Updated 18.6.2025 Background Stora Enso is a company based in Finland and Sweden, and develops solutions based on wood and biomass for a diverse range of industries...
Kyla Ball
5 min read
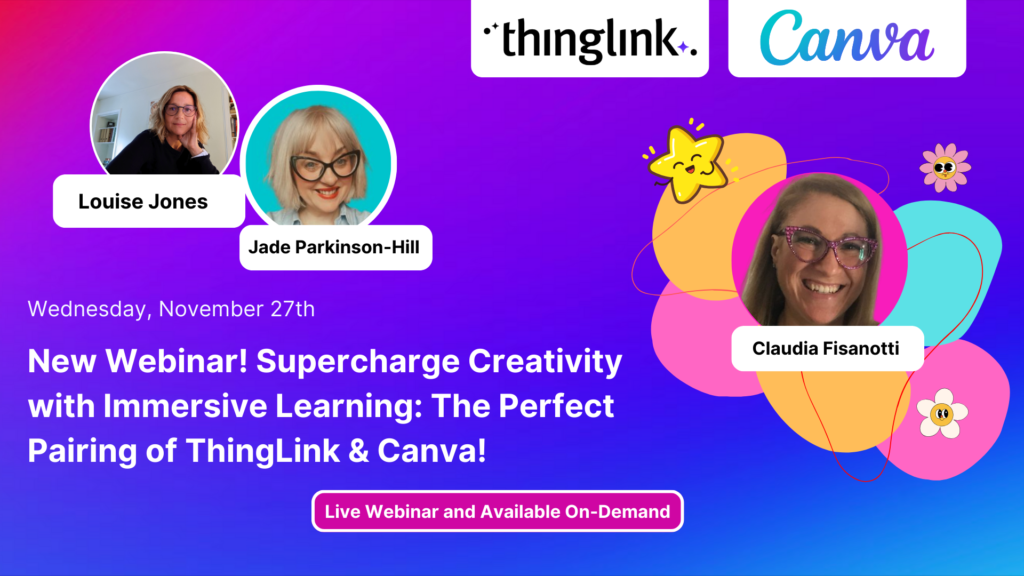
Join us for an exclusive look into how Canva and ThingLink complement each other to create a powerful toolkit for immersive learning experiences! Are you ready ...
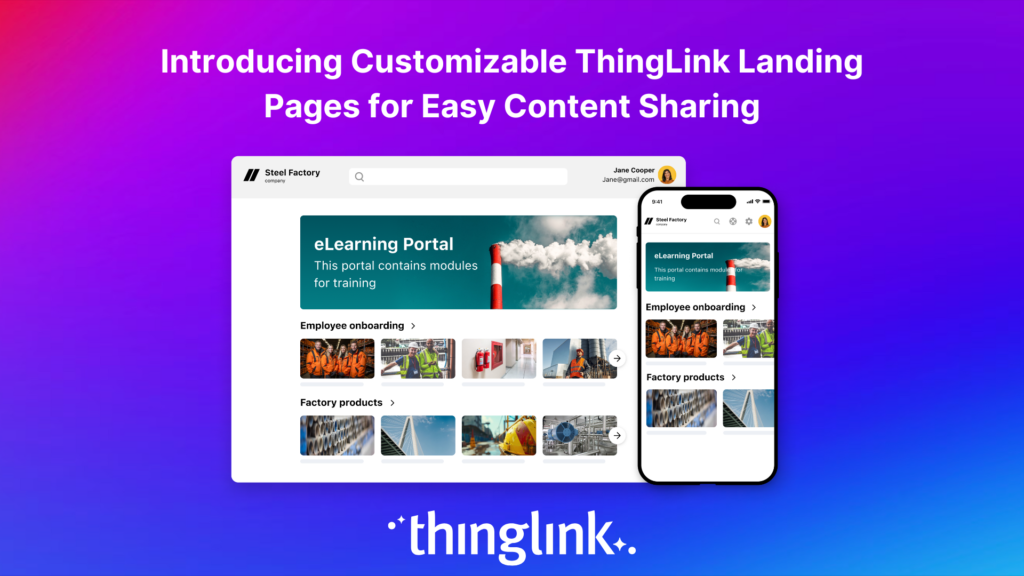
Following recent updates and improvements to ThingLink Scenario Builder, ThingLink now allows organizations to create customizable landing pages for easy sharing...
Here are some commonly asked questions and answers, if you do not find an answer that resolves your question please do not hesitate to get in touch with us at support@thinglink.com...
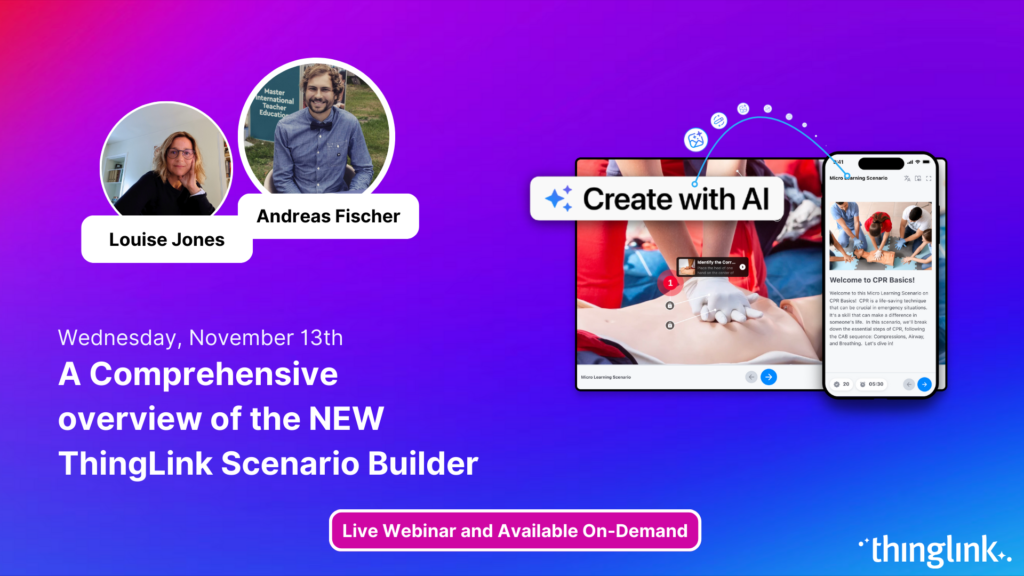
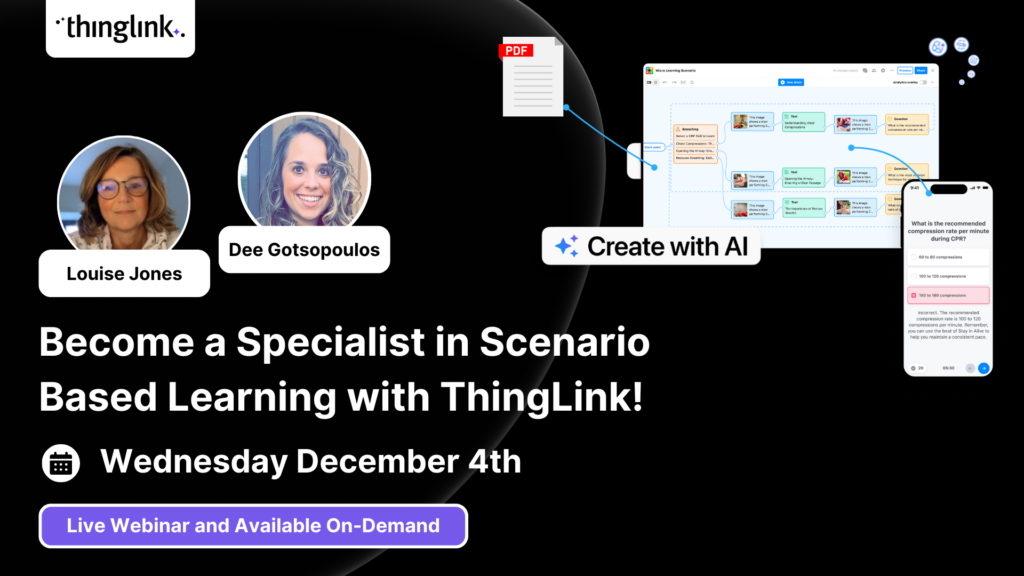
Join us for an exciting exploration of ThingLink’s updated Scenario Builder! In this session, we’ll showcase two powerful paths for scenario creation: building...
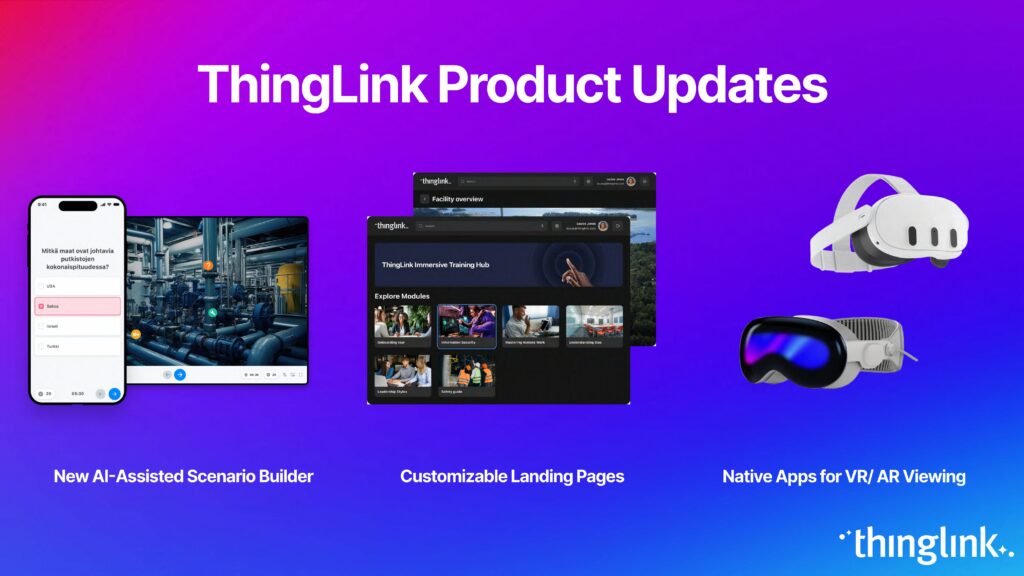
Over the next few weeks, ThingLink will be rolling out a series of new or updated products that are essential for any organization that is looking to modernize ...
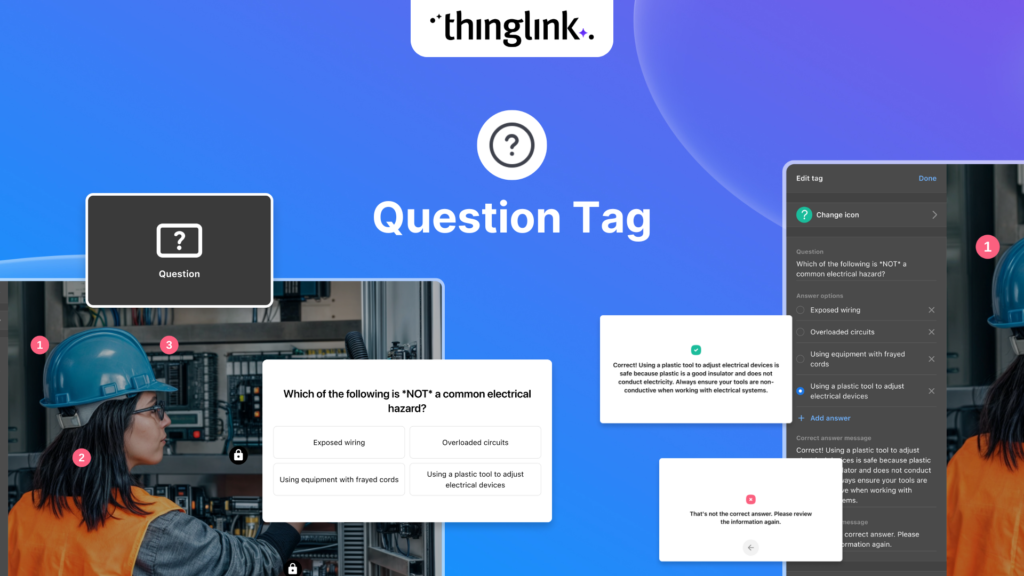
We’re thrilled to introduce a brand-new feature to enhance your learning experiences – the new question tag type for the ThingLink Multimedia Editor! Whether...
Introduction With the development of new technologies, the boundaries between physical and digital learning spaces are being redefined. Yet, these environments ...
Updates and improvements to ThingLink’s Scenario Builder offer a quick and easy solution for creating immersive learning and interactive training experiences,...
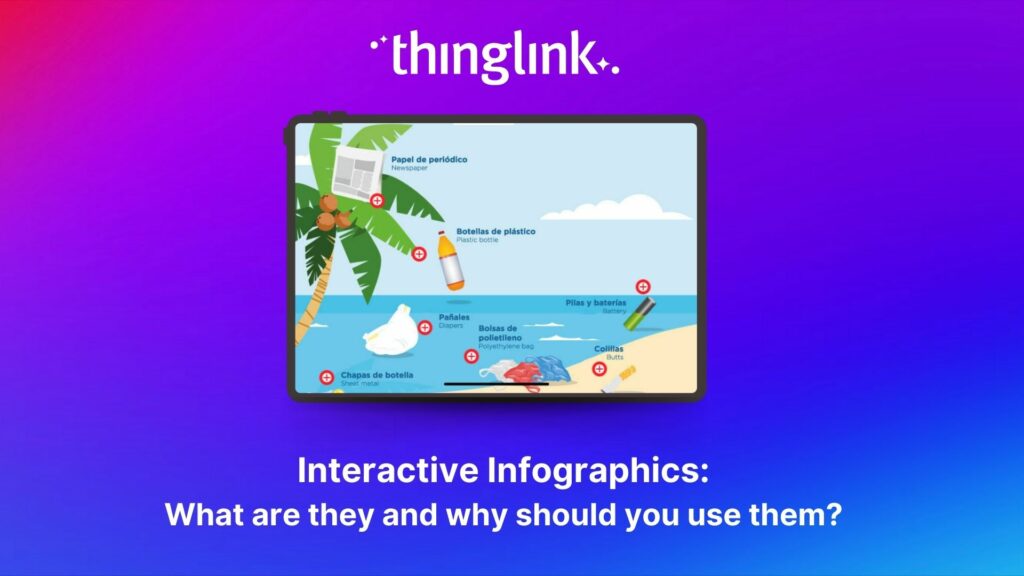
Infographics are the fastest and easiest way to present any complex information. In this blog we’ll show you how to create interactive infographic designs even...
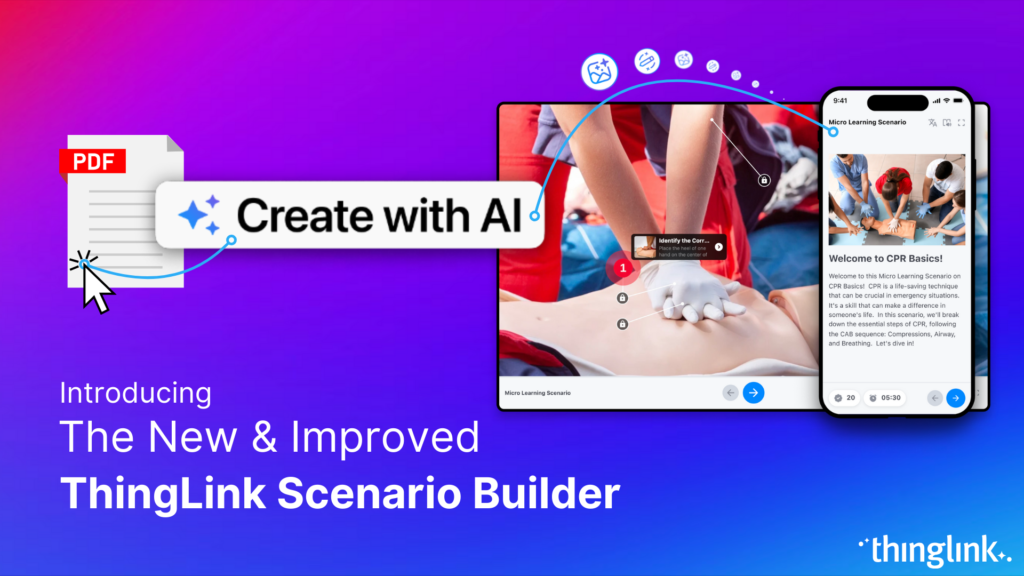
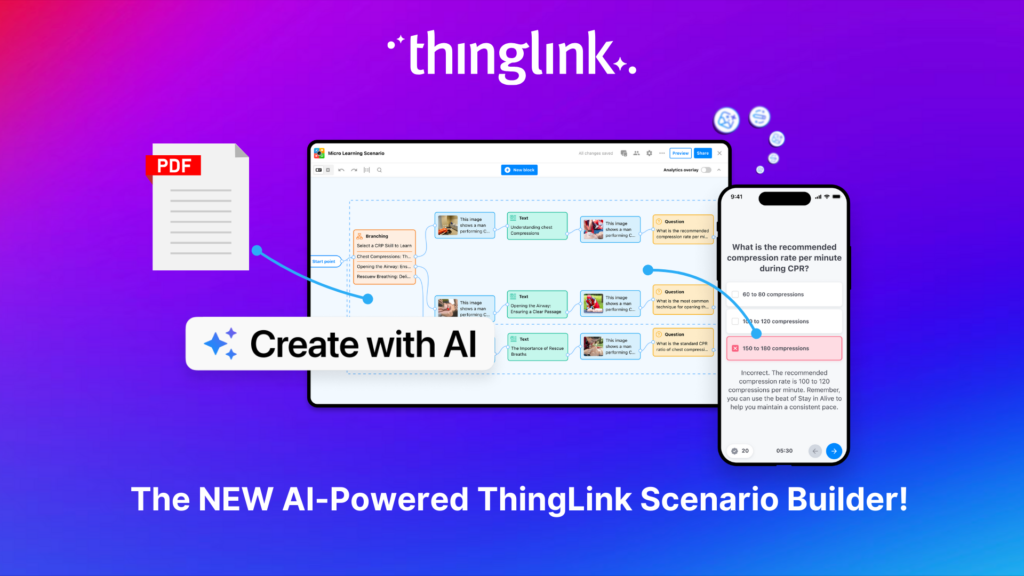
Discover the New ThingLink Scenario Builder and Ways to Transform the Static to Interactive In Fall 2024, ThingLink revolutionized the world of Scenario Based Learning...
Meet the new and improved ThingLink Scenario Builder, your ultimate tool for transforming static content into immersive, interactive experiences. With AI-powered...
Rob McCrae is the AI Lead and ICT Director at Diocesan School for Girls in Auckland, New Zealand, an independent school of 1600 students aged 5-18. Earlier this...
Kyla Ball
5 min read
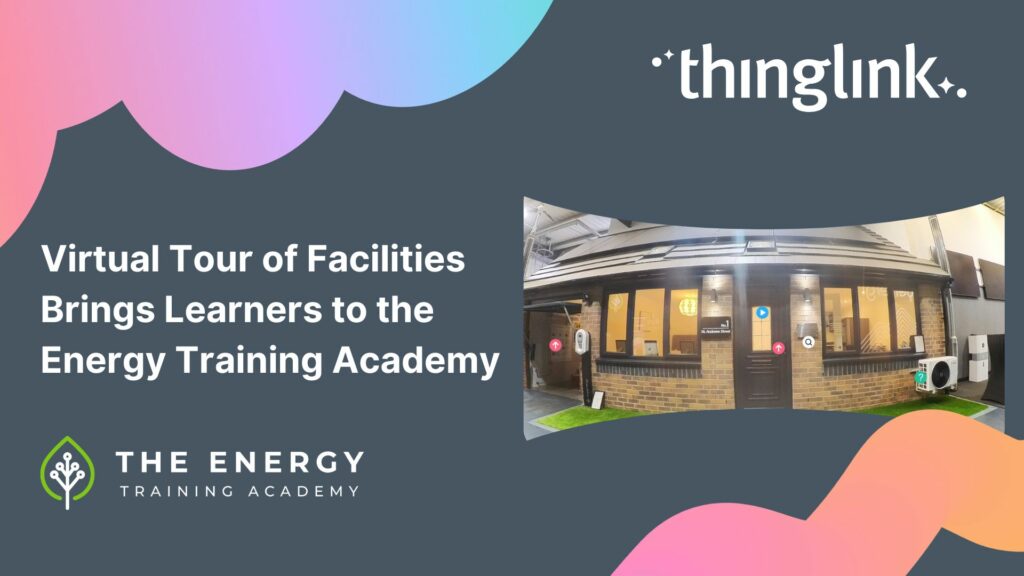
In this case study we explore how an innovative training provider is using ThingLink to help attract and develop the next generation of heating engineers ready ...
Kyla Ball
6 min read
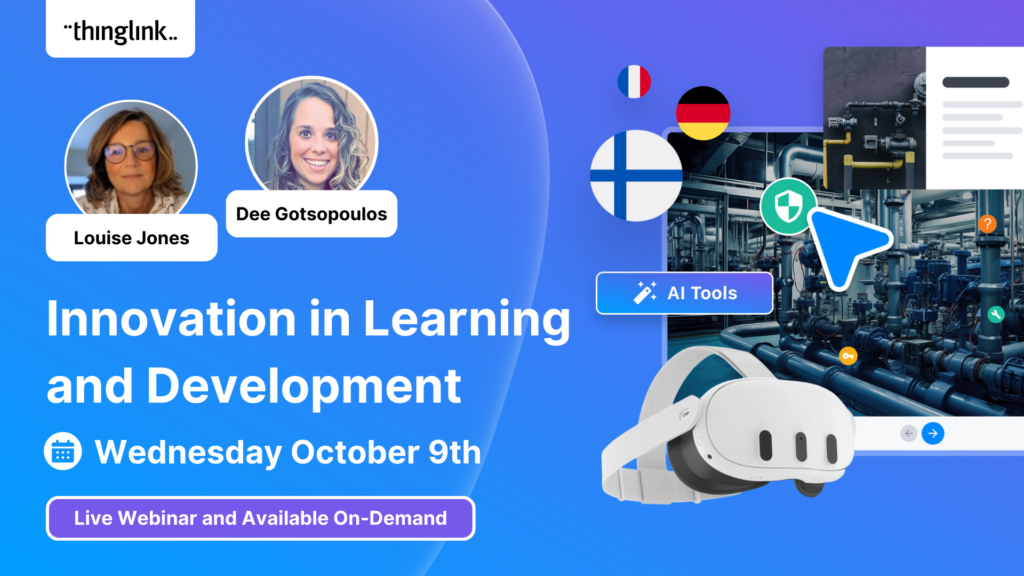
To help you stay ahead, we’re excited to present our webinar “Innovation in Learning and Development”, where we’ll explore these emerging trends...
Mitsubishi Electric was founded over a century ago and now has offices around the world. The first Mitsubishi Electric UK (MEUK) office opened in 1969 and since...
Kyla Ball
7 min read