Creating Interactive Simulations for Real-World Readiness: Immersive Learning for Medical Schools & Healthcare Teams Where and When 📅 Date: Wednesday 6th...
LEO, a forward-thinking British multi-academy trust, has pioneered a structured, pedagogy-first approach to digital learning that has driven significant gains in...
 Louise Jones
10 min read
At ThingLink, our mission is to empower educators, trainers, and content creators to build truly impactful digital learning experiences. We believe that great learning...
Solve System-Wide Challenges with Easy Creation, XR/VR Integration & Interactive Content Join Louise, ThingLink and Cheryl Shirley, Director of Digital Learning...
The other day I was watching my close friend’s seven-year-old son do something that completely stopped me in my tracks (if you’ll excuse the pun). Nico...
The foundations of ThingLink are rooted in the socio-cultural theory of learning developed by Lev Vygotsky. My own journey began in 2003 at the Center for Activity...
When their usual arts venue became unavailable for Nottingham College’s end-of-year show, the organizers found the ideal way to recreate and share the works...
 Kyla Ball
4 min read
The global workforce is constantly evolving, which means that the strategies that companies use to attract and retain top talent have to evolve to keep pace. As...
 Kyla Ball
5 min read
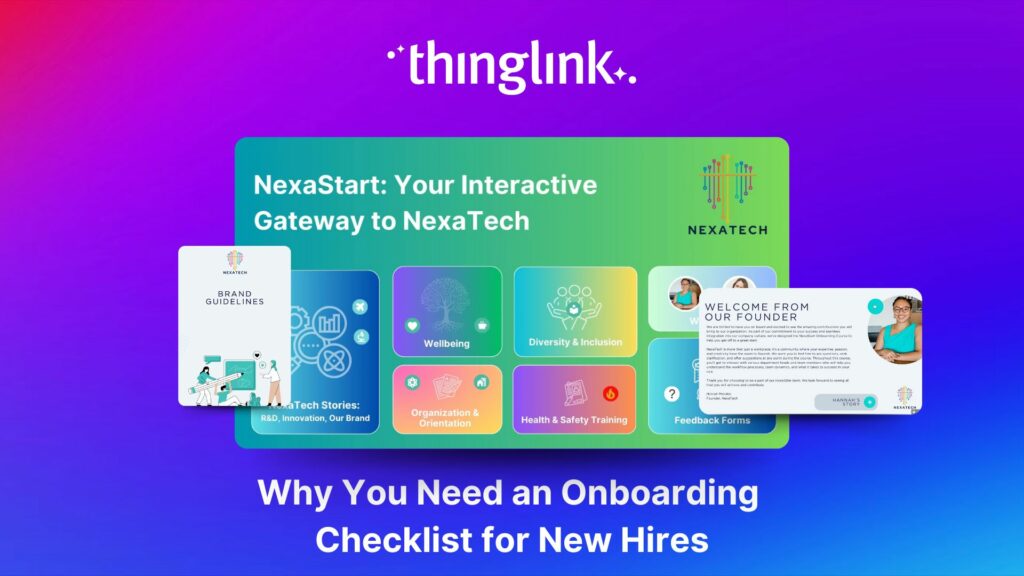
Welcoming a new employee should be an exciting time for any organization — but without a clear onboarding checklist, it can quickly become overwhelming for both...
 Kyla Ball
5 min read
How Mitsubishi Electric UK Scales Immersive VR Training with ThingLink Securing the Next Generation of Engineers: How Mitsubishi Electric is Solving the Talent ...
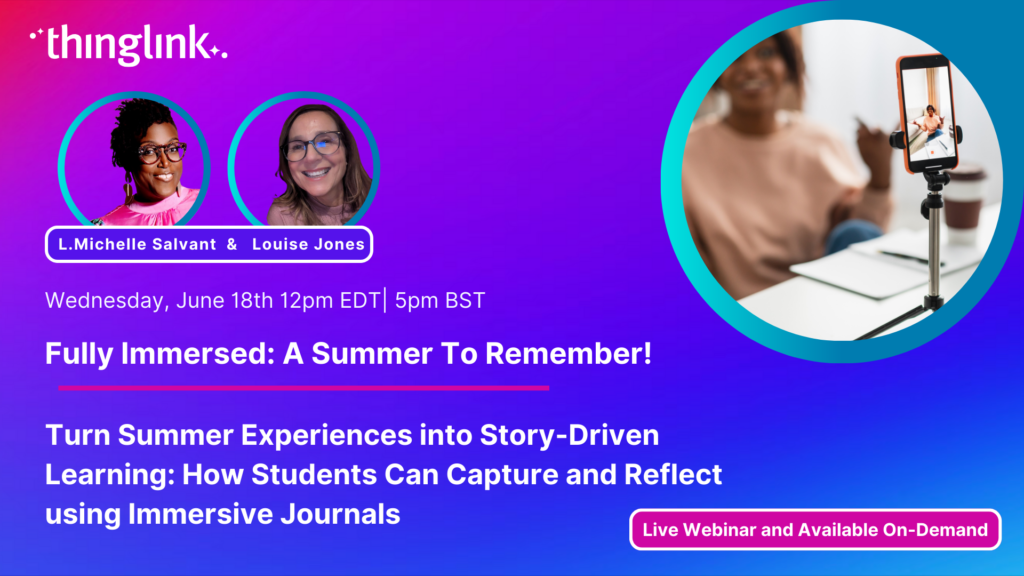
Turn Summer Experiences into Story-Driven Learning: How Students Can Capture and Reflect using Immersive Journals Make it a Summer to Remember Join Louise Jones...
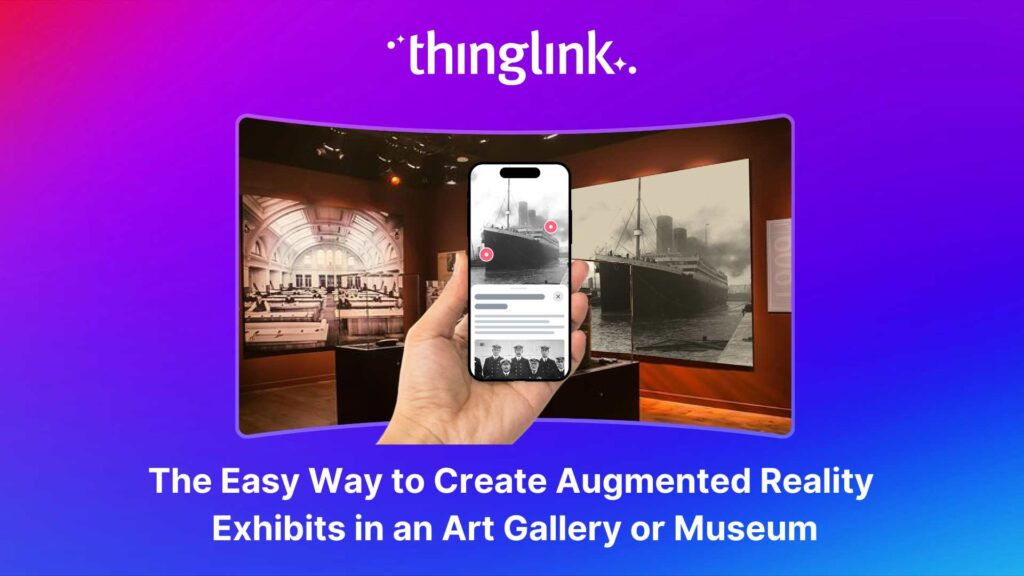
Over the last decade, mixed reality experiences using immersive technology have become increasingly commonplace throughout museums and art galleries worldwide. ...
 Kyla Ball
5 min read
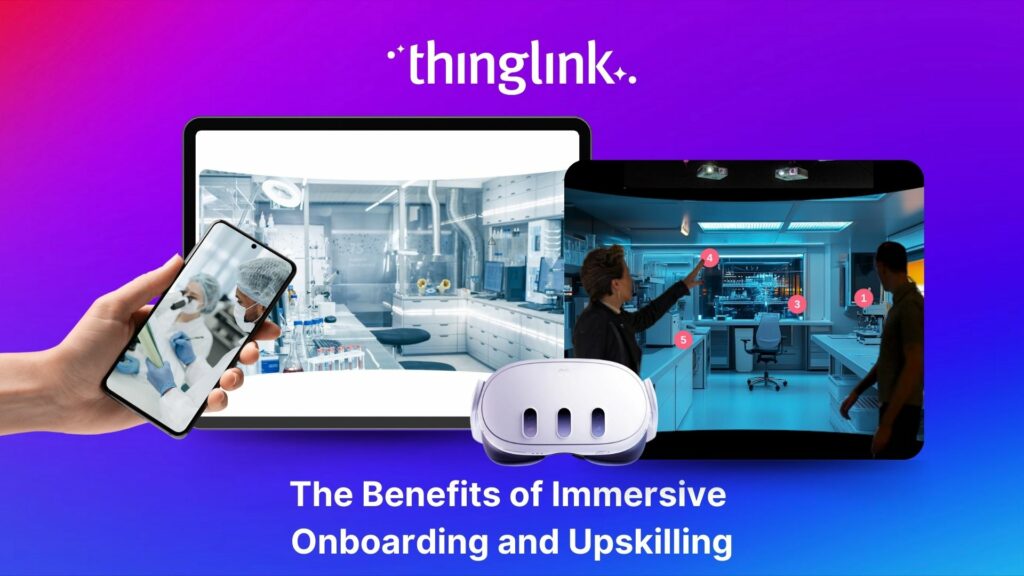
Whether bringing new hires up to speed or developing existing talent, an immersive approach to onboarding and upskilling delivers more engaging, memorable and scalable...
 Kyla Ball
9 min read
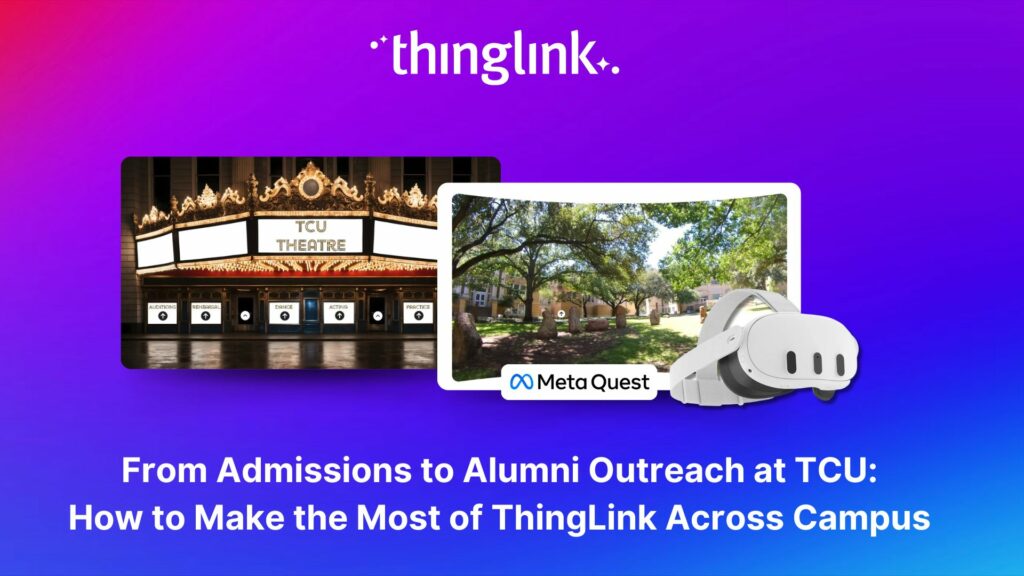
Background Texas Christian University (TCU) is a private university of around 9000 undergrads, situated in the city of Fort Worth within the Dallas Fort Worth metroplex....
 Kyla Ball
7 min read
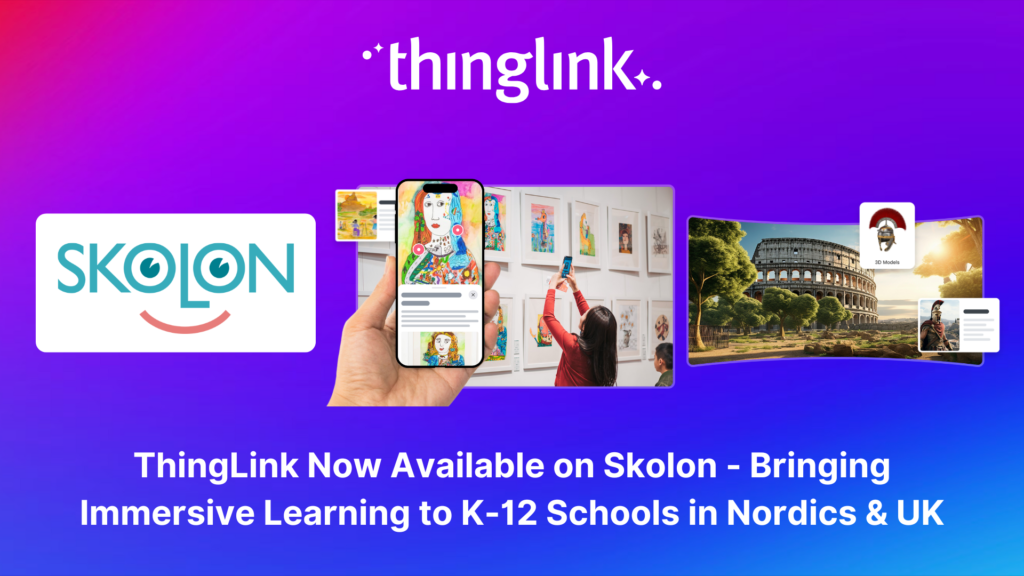
Stockholm, April 8th, 2025 – ThingLink, the leading platform for creating and sharing immersive learning experiences across platforms and devices, is now available...
Immersive learning technologies like ThingLink are transforming education! Research shows they improve engagement, comprehension, and knowledge retention—making...
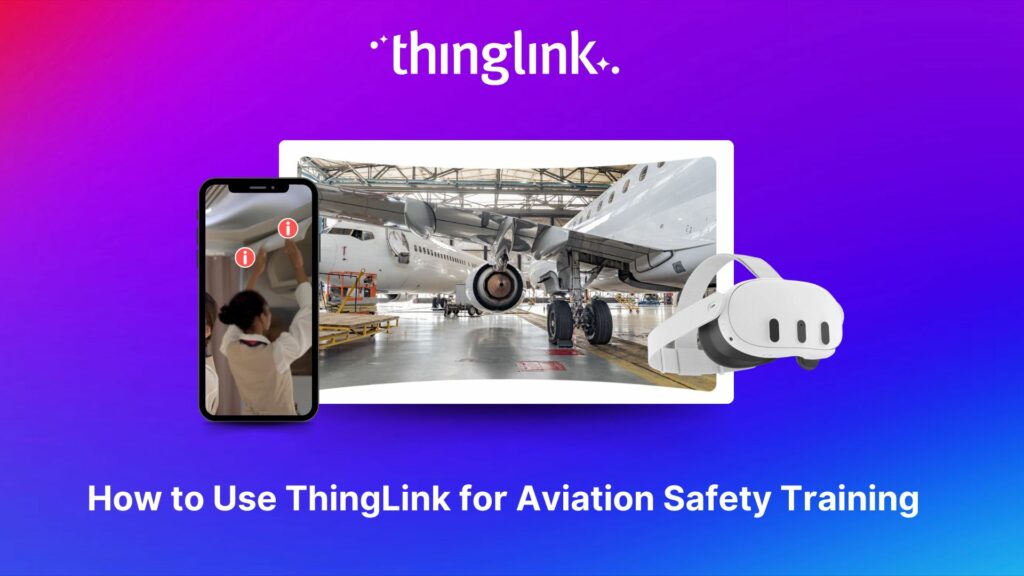
The high-stakes nature of aviation safety demands effective and engaging training methods. Traditional employee training approaches such as instructor-led training...
 Kyla Ball
5 min read
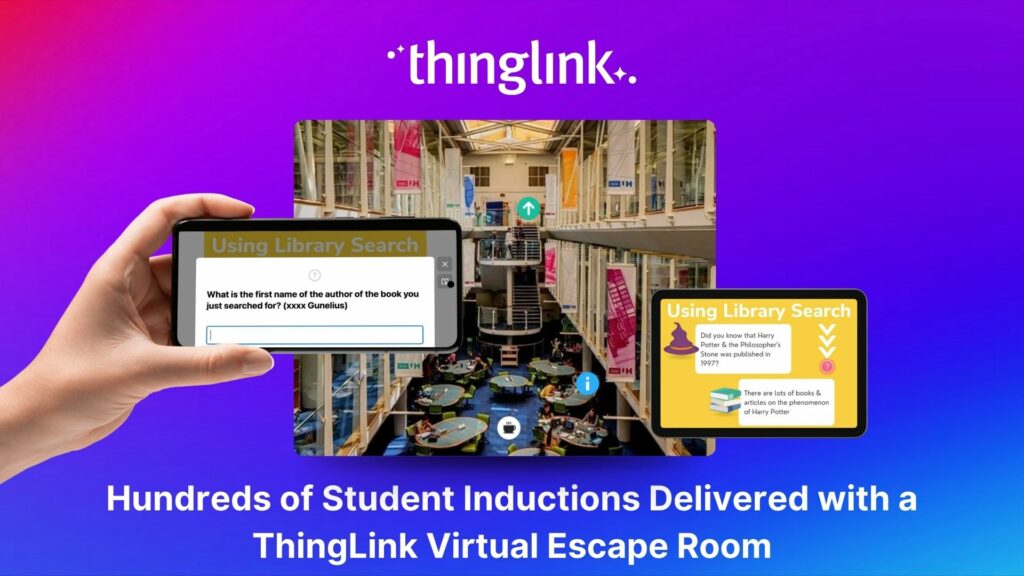
Louise Conway, Information Manager at the University of Hertfordshire (UK) has created an ingenious, engaging virtual escape room to ensure that new students are...
 Kyla Ball
7 min read
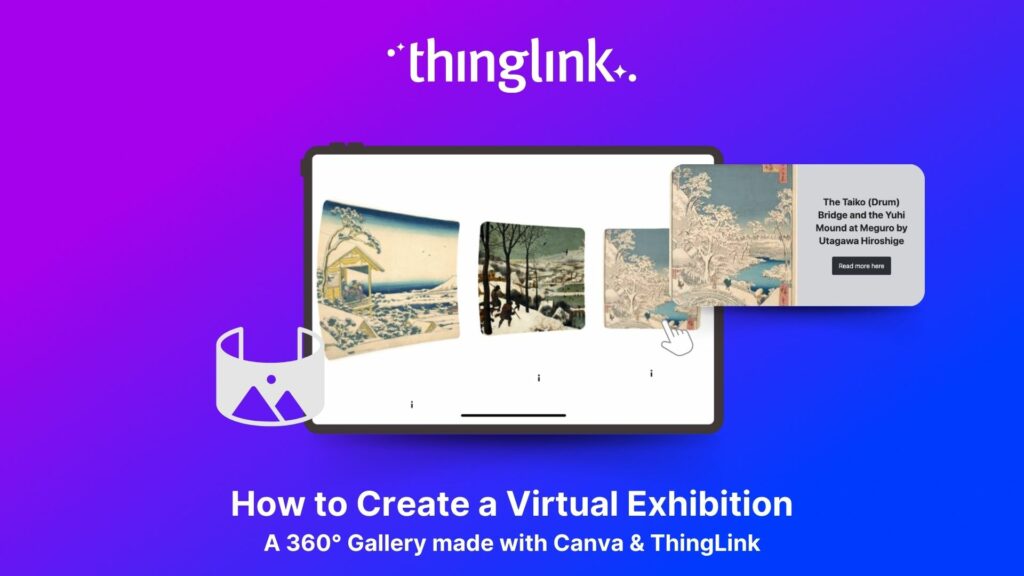
We show you how to make your own interactive 360° virtual art gallery with our Canva template and ThingLink The ThingLink Team have devised a quick and easy way...
 Kyla Ball
4 min read
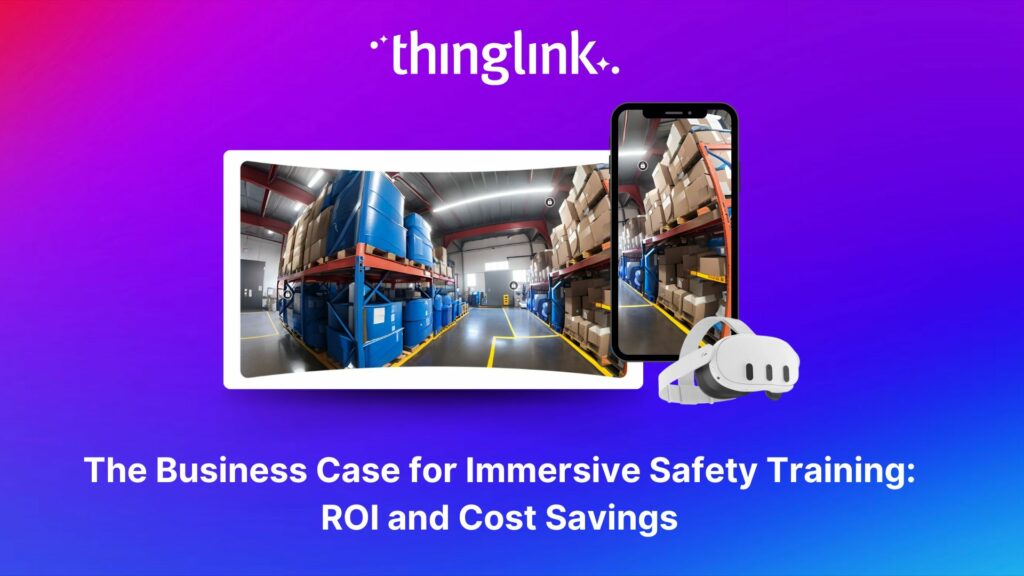
The human and financial costs associated with an accident at work are potentially catastrophic for any business, both in the immediate term and in terms of reputational...
 Kyla Ball
11 min read
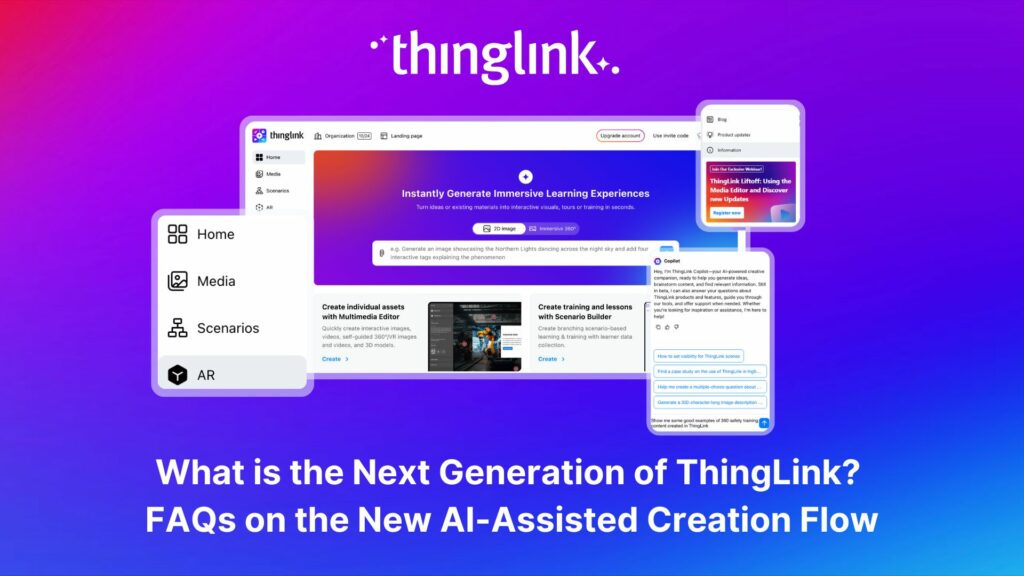
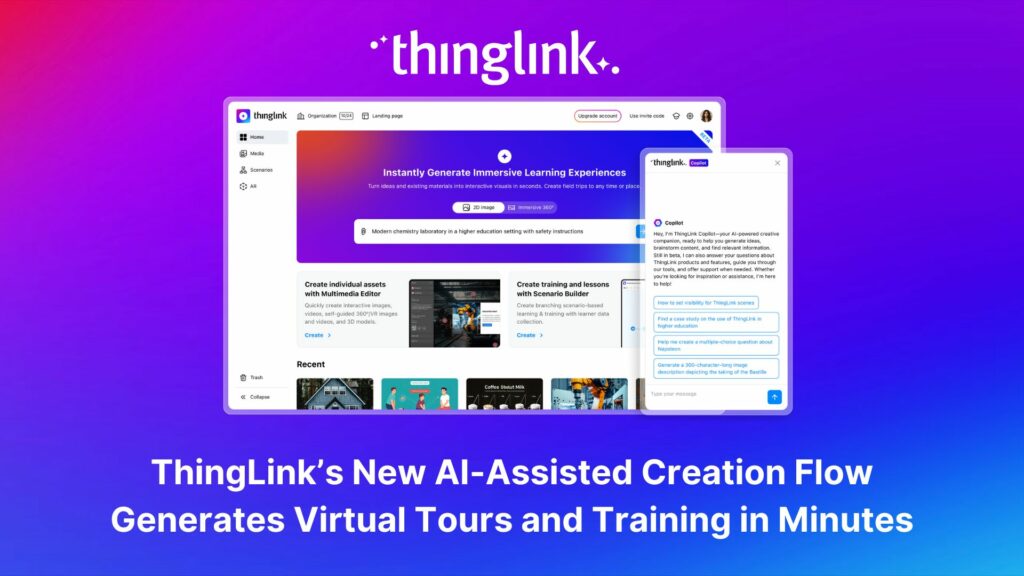
The next generation of ThingLink has launched, with the same easy-to-use immersive learning creation tools now accessible via a fresh new interface. Create interactive...
 Kyla Ball
4 min read
💡 Did you know that organizations with a strong onboarding process improve new hire retention by 81% and productivity by over 50%?!* The days before and at the...
ThingLink, the AI-assisted immersive content creation platform for training and education, continues to grow its global team alongside the expansion and development...
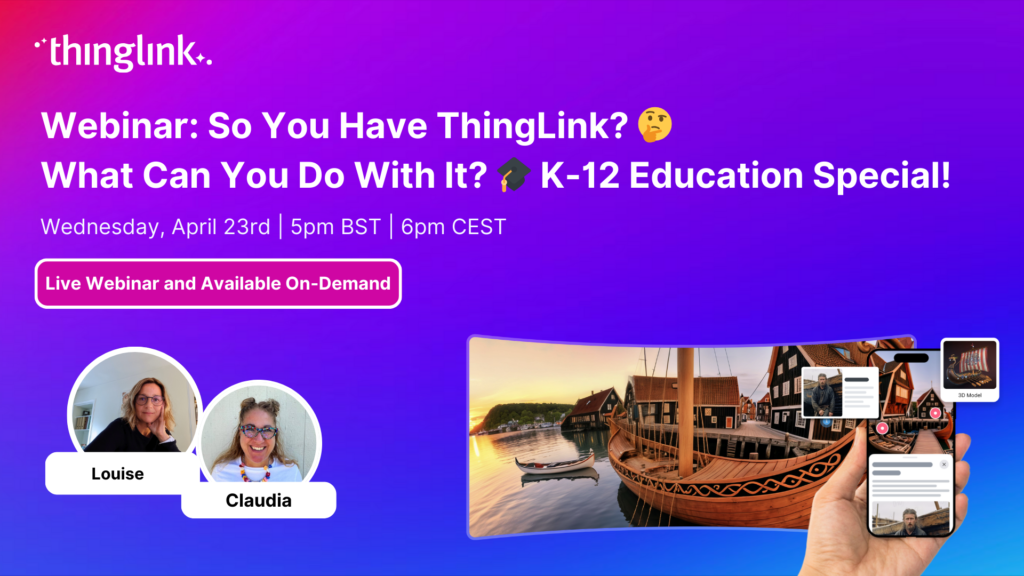
Spring into Immersive Learning! 🌱 Join your hosts Louise and Claudia for a playful and engaging session on the rise of immersive learning! We’ll explore new...
As digital transformation accelerates across industries, the demand for intuitive AI tools that empower non-technical users to create sophisticated learning experiences...
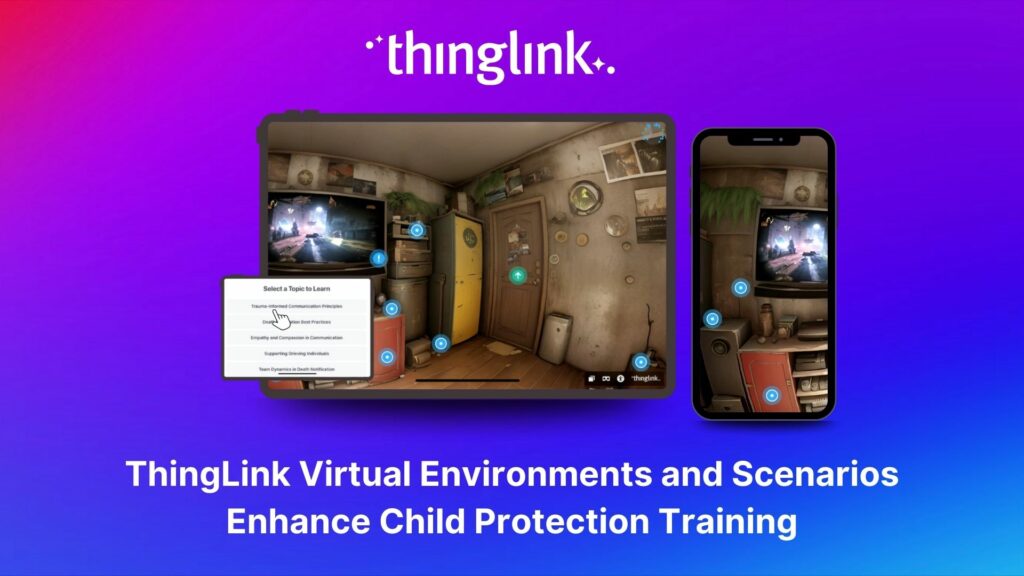
Background Zero Abuse Project (founded in 2018) is a non-profit organization based in the US. Their mission is “To protect children from abuse and sexual assault,...
 Kyla Ball
8 min read
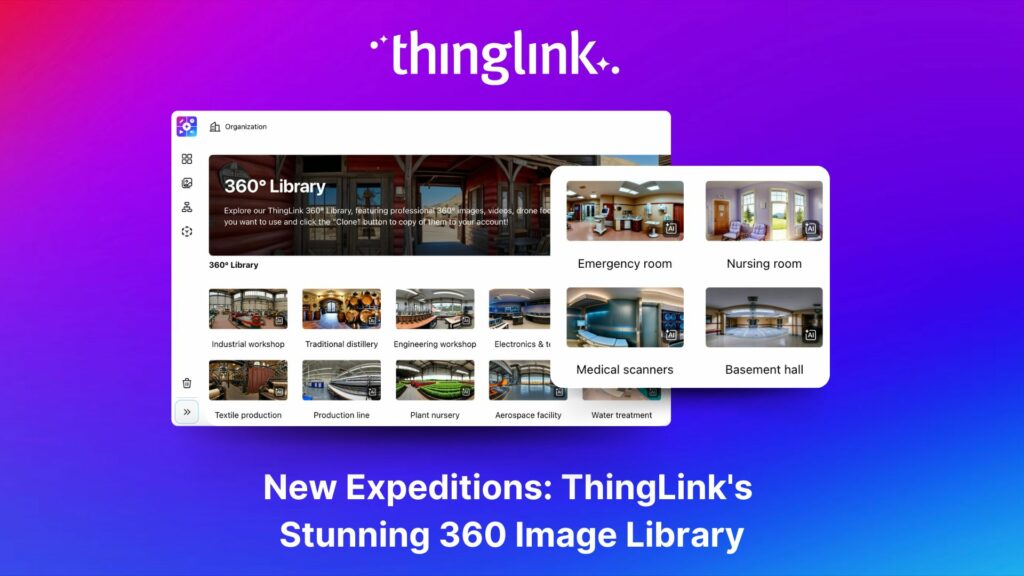
ThingLink’s 360 Image Library is a curated collection of professional 360 images from culturally relevant natural and historic sites. You can use the images...
 Kyla Ball
4 min read
As the modern workforce evolves, creating employee training programs that are engaging, impactful, and scalable has been a growing challenge for organizations. ...
Join us for an inspiring and practical webinar where Crosthwaite Primary School share how they’ve designed their curriculum to foster creativity, community collaboration,...
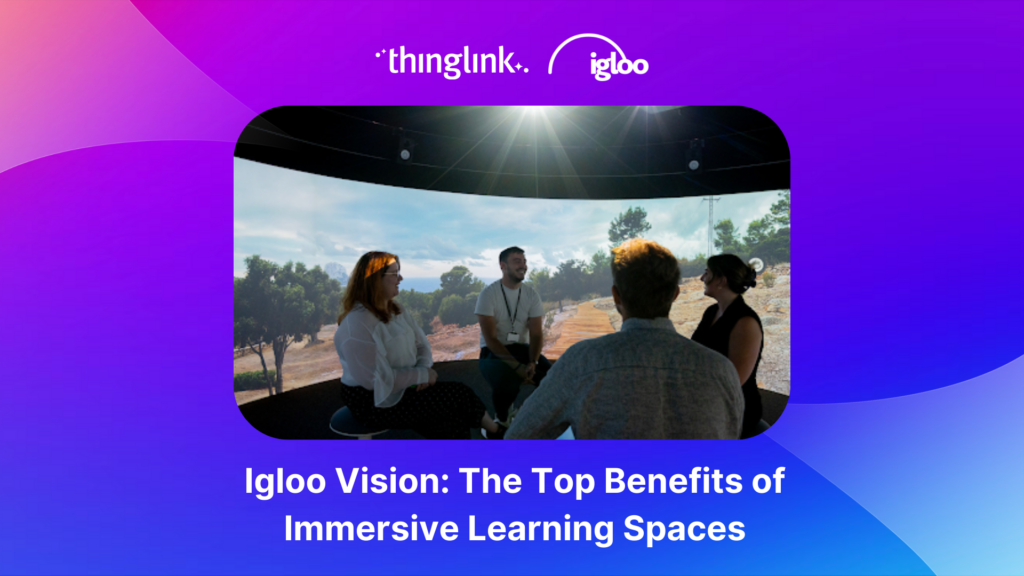
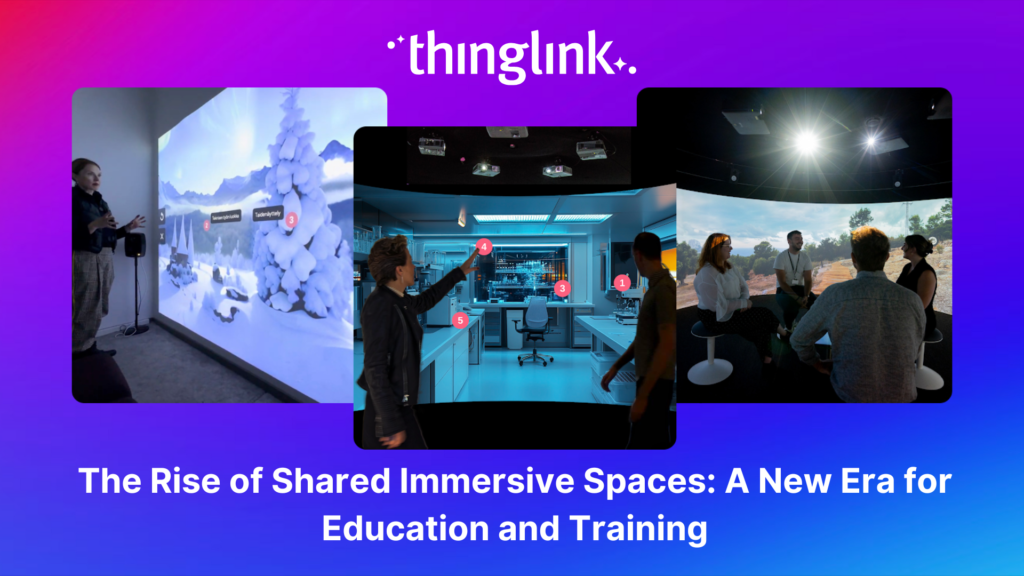
The increasing interest and adoption of shared immersive spaces in recent years reflects a shift in the way we see the future of learning, future of education, ...
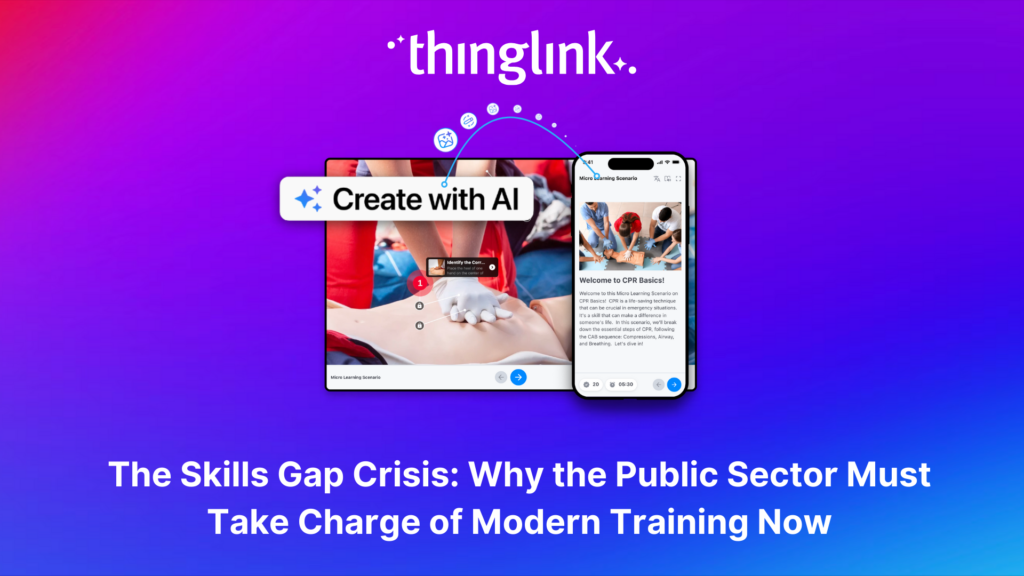
The world of work is evolving faster than ever, transforming industries and creating new demands on the workforce. While the private sector and higher education...
As organizations transition from a Generation X-dominated workforce to one led by Millennials and Generation Z, the need to modernize training programs has become...
Join us for an unmissable webinar celebrating a year of innovations with ThingLink! 🌟 We are excited to invite you to discover all the incredible updates we’ve...
Updated 18.6.2025 Background Stora Enso is a company based in Finland and Sweden, and develops solutions based on wood and biomass for a diverse range of industries...
 Kyla Ball
5 min read
Join us for an exclusive look into how Canva and ThingLink complement each other to create a powerful toolkit for immersive learning experiences! Are you ready ...
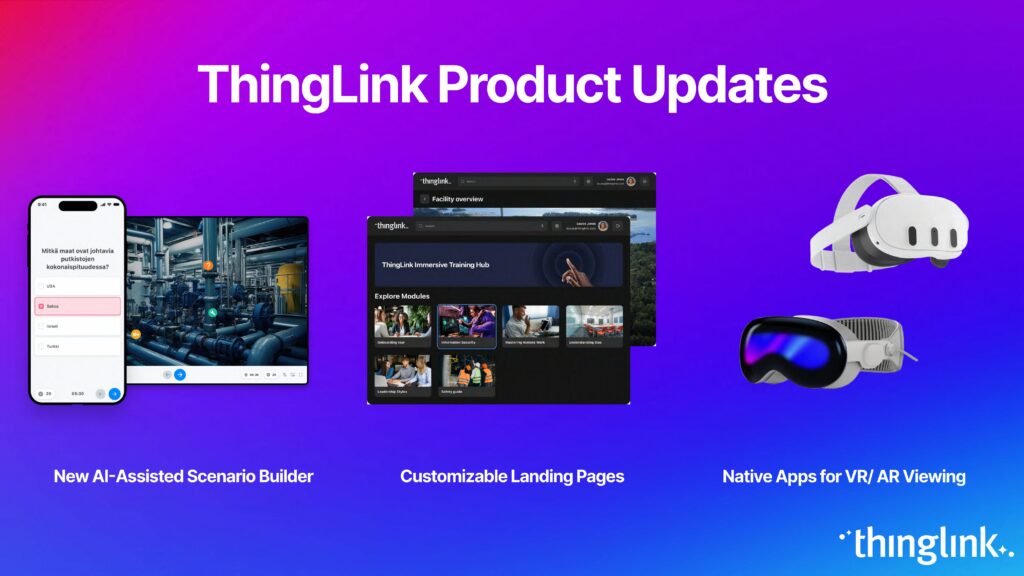
Following recent updates and improvements to ThingLink Scenario Builder, ThingLink now allows organizations to create customizable landing pages for easy sharing...
Here are some commonly asked questions and answers, if you do not find an answer that resolves your question please do not hesitate to get in touch with us at support@thinglink.com...
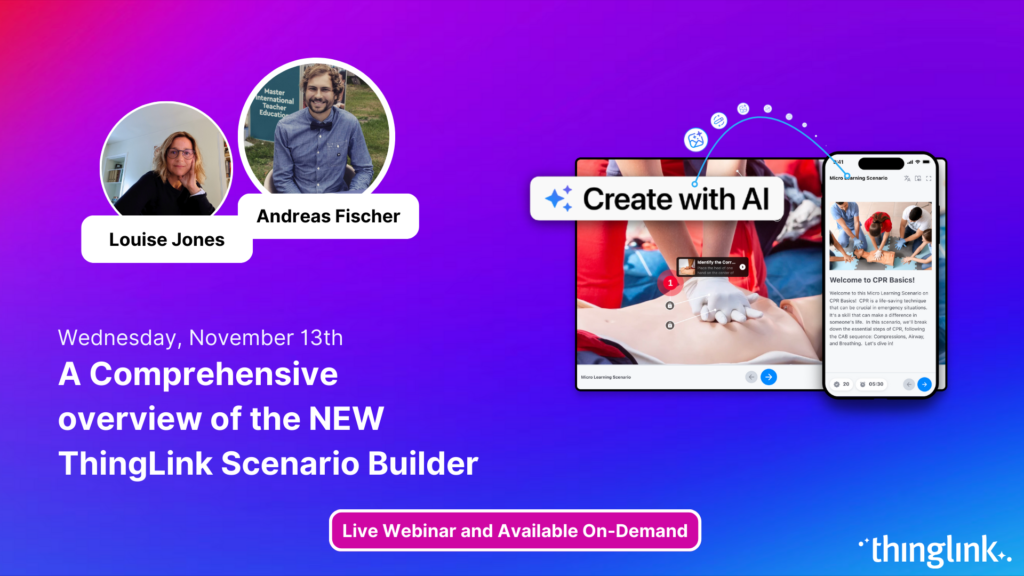
Join us for an exciting exploration of ThingLink’s updated Scenario Builder! In this session, we’ll showcase two powerful paths for scenario creation: building...
Over the next few weeks, ThingLink will be rolling out a series of new or updated products that are essential for any organization that is looking to modernize ...
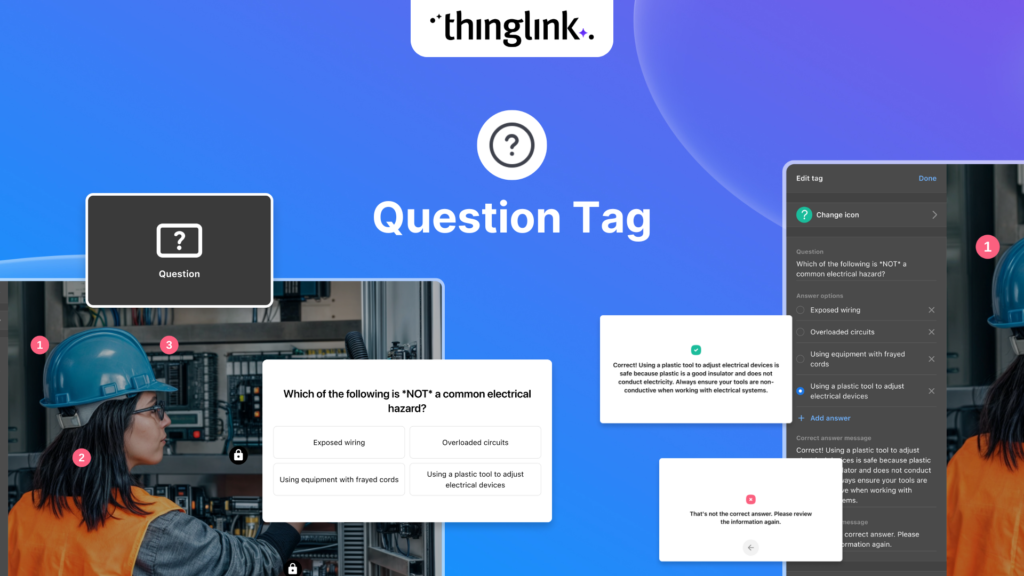
We’re thrilled to introduce a brand-new feature to enhance your learning experiences – the new question tag type for the ThingLink Multimedia Editor! Whether...
Introduction With the development of new technologies, the boundaries between physical and digital learning spaces are being redefined. Yet, these environments ...
Updates and improvements to ThingLink’s Scenario Builder offer a quick and easy solution for creating immersive learning and interactive training experiences,...
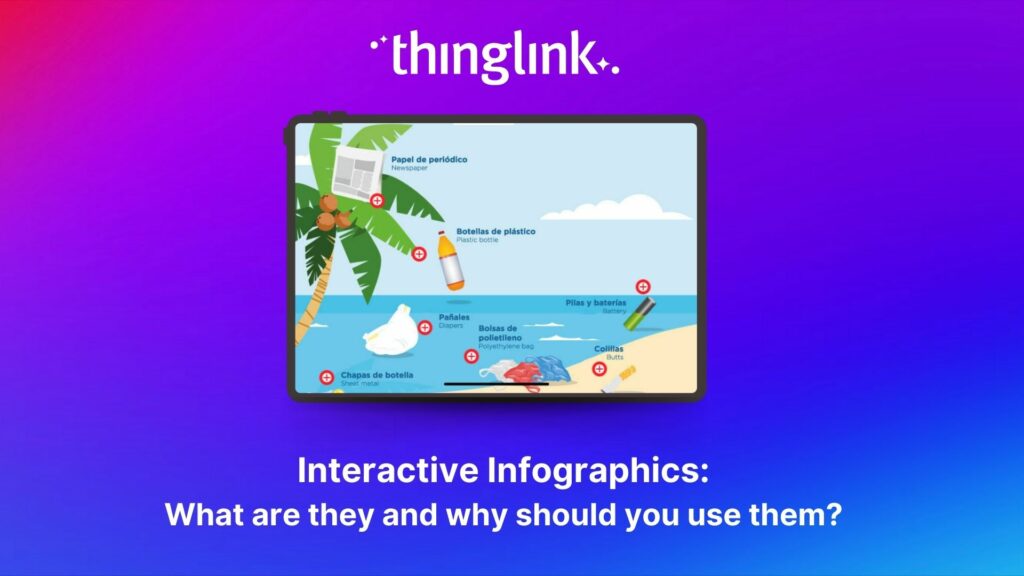
Infographics are the fastest and easiest way to present any complex information. In this blog we’ll show you how to create interactive infographic designs even...
Discover the New ThingLink Scenario Builder and Ways to Transform the Static to Interactive In Fall 2024, ThingLink revolutionized the world of Scenario Based Learning...
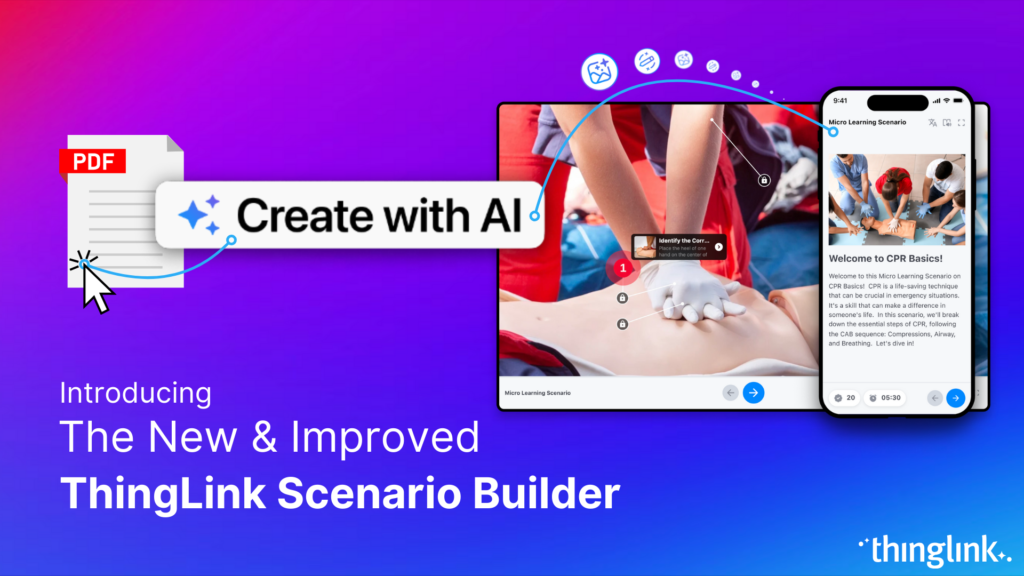
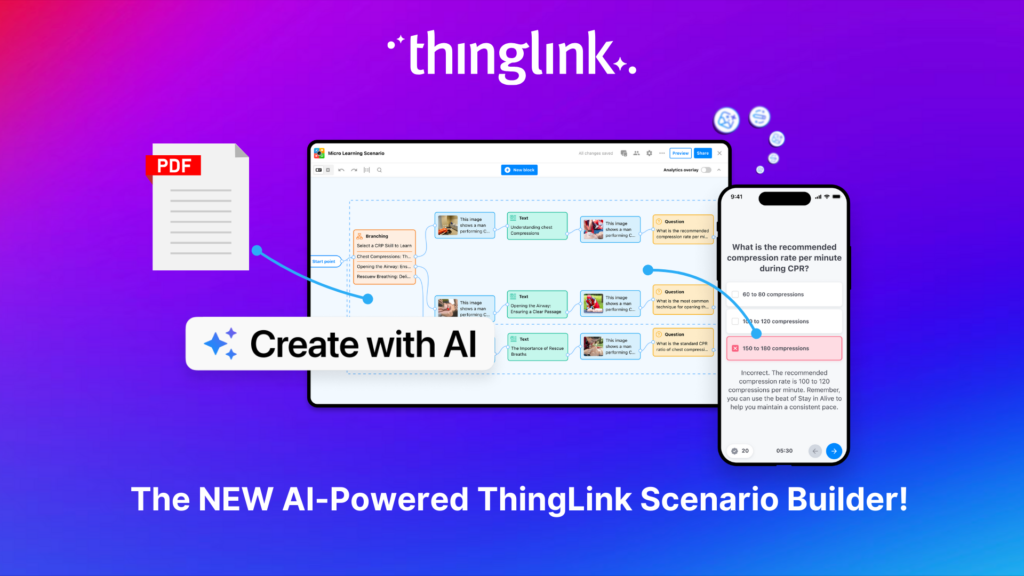
Meet the new and improved ThingLink Scenario Builder, your ultimate tool for transforming static content into immersive, interactive experiences. With AI-powered...
Rob McCrae is the AI Lead and ICT Director at Diocesan School for Girls in Auckland, New Zealand, an independent school of 1600 students aged 5-18. Earlier this...
 Kyla Ball
5 min read
In this case study we explore how an innovative training provider is using ThingLink to help attract and develop the next generation of heating engineers ready ...
 Kyla Ball
6 min read
To help you stay ahead, we’re excited to present our webinar “Innovation in Learning and Development”, where we’ll explore these emerging trends...
Mitsubishi Electric was founded over a century ago and now has offices around the world. The first Mitsubishi Electric UK (MEUK) office opened in 1969 and since...
 Kyla Ball
7 min read
We are delighted to share that ThingLink now supports xAPI for tracking and sharing analytics from immersive learning experiences with other learning systems. This,...
Unlocking the Power of xAPI: Enhancing ThingLink’s Integration Capabilities Introduction: In the fast-evolving world of digital learning, tracking and analyzing...
Introduction: Operational resilience is no longer just about maintaining business continuity; it’s about staying adaptable and responsive to evolving challenges....
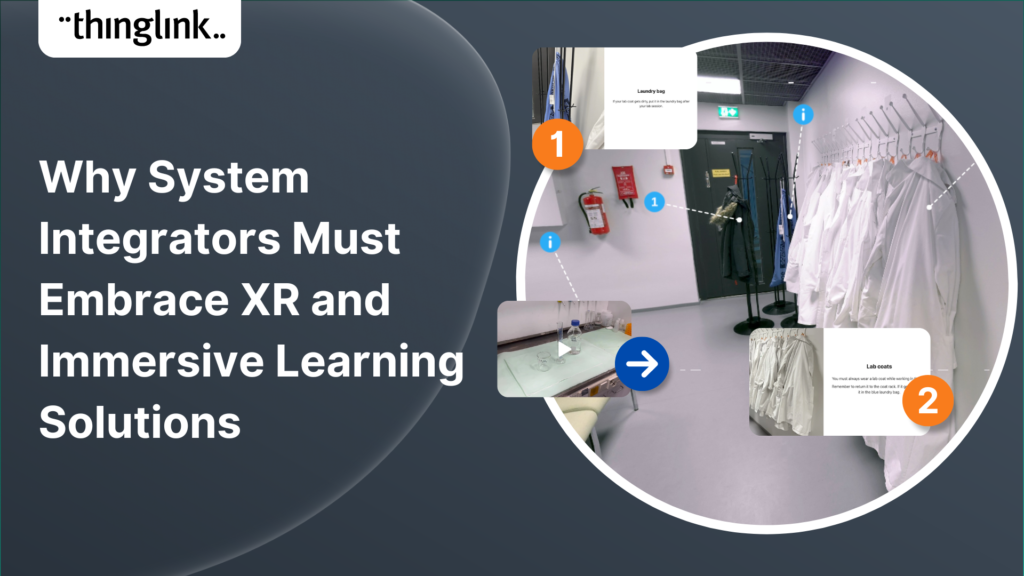
In an era where learning experiences are rapidly evolving, system integrators hold a critical role in helping organizations upgrade their digital learning infrastructures....
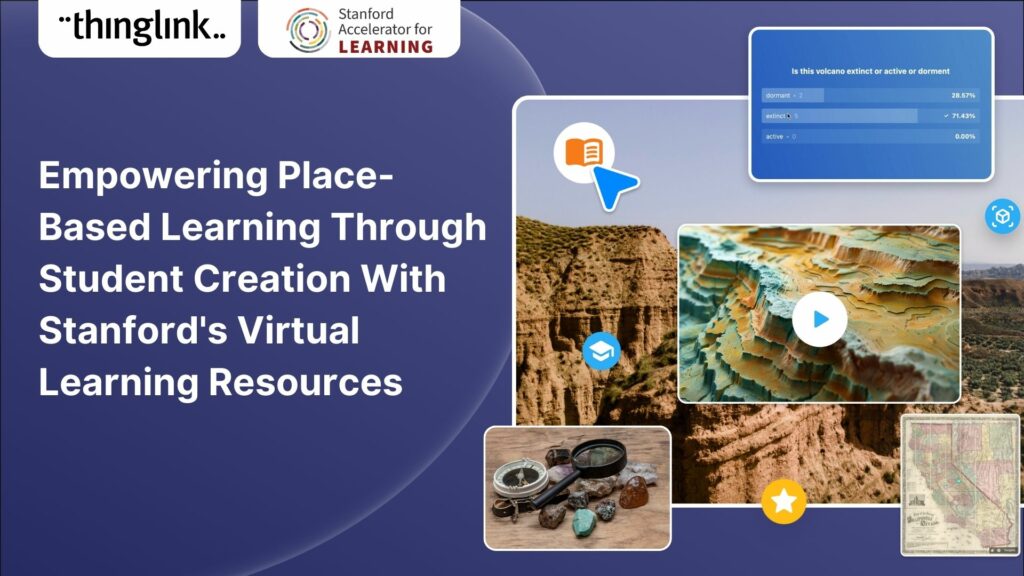
For educators looking to encourage student creation, Stanford University’s essential guide will show you how to use content from real-life Field Trips in ...
 Kyla Ball
7 min read
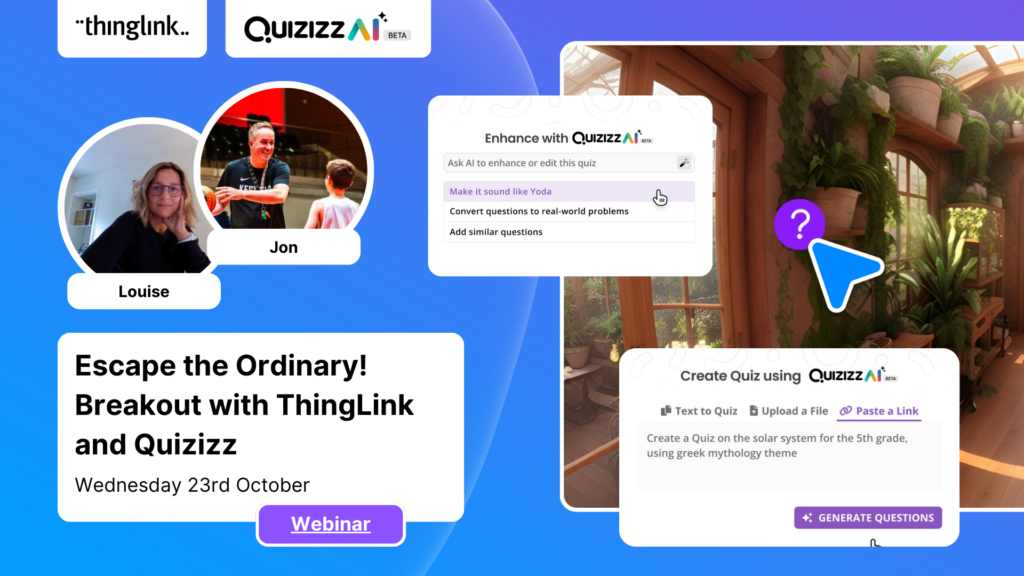
Escape the Ordinary! Breakout with ThingLink and Quizizz Immersive Escape Rooms and Breakouts can be very effective and engaging for all learners. Our past webinars...
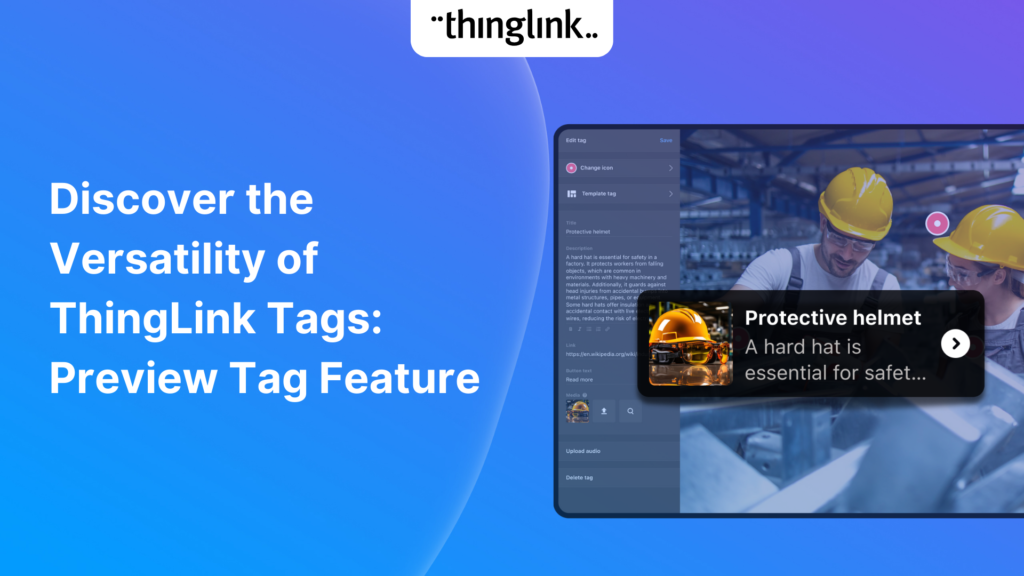
We’re excited to introduce a feature that helps reduce cognitive overload by offering a quick preview of what’s inside text and media tags. Now, when viewers...
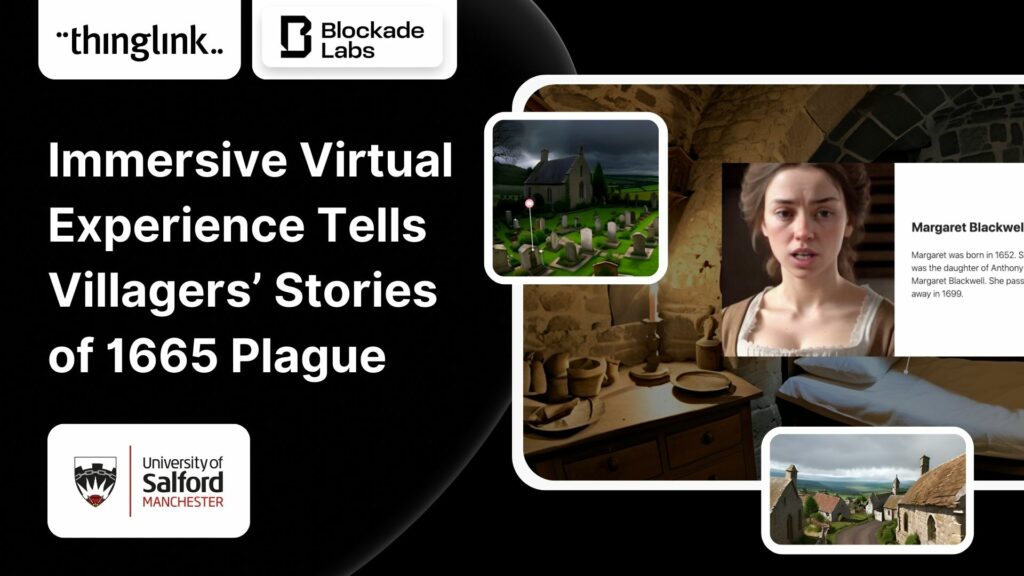
Immersive Virtual Experience Tells Villagers’ Stories of 1665 Plague A team at the University of Salford have created an immersive virtual experience of Eyam,...
 Kyla Ball
3 min read
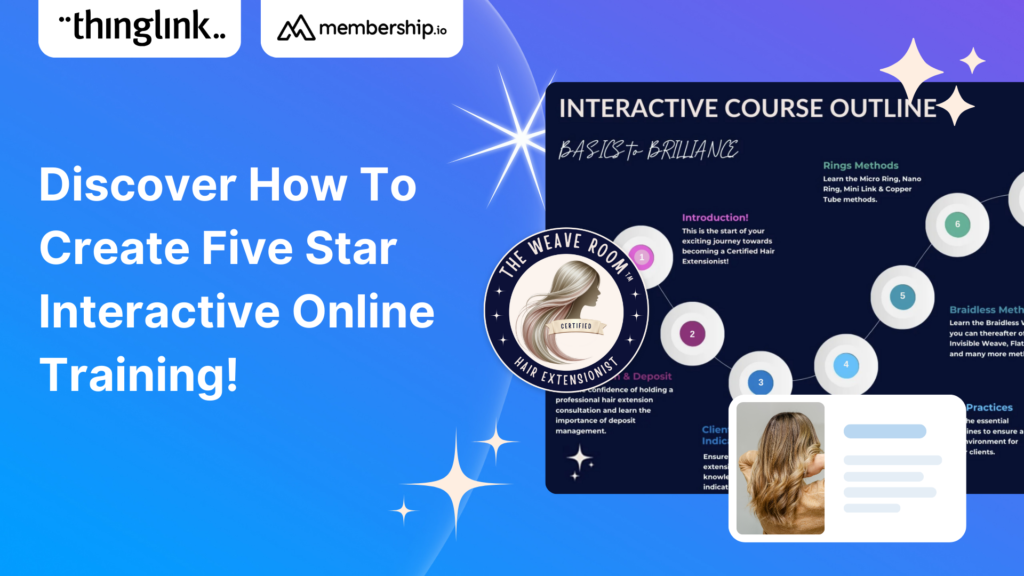
This post presents the background of how the The Weave RoomTM created an engaging, interactive and polished online training course with ThingLink, which was so ...
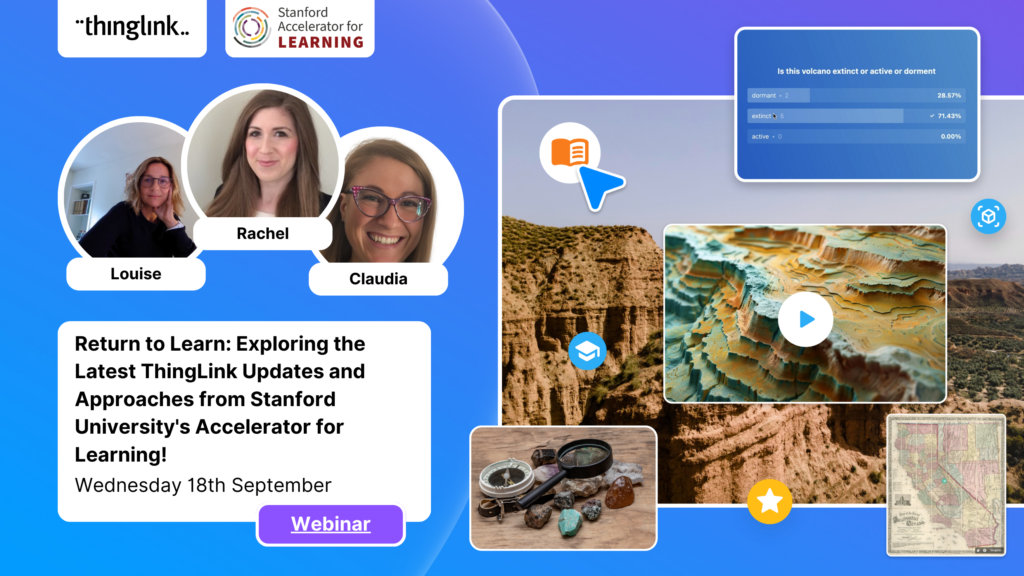
It’s that time of year for the FREE annual ‘Return to Learn’ webinar! Join us for an exciting and informative webinar as we present the latest ThingLink updates,...
ThingLink now holds the ISO 27001 certification, a globally recognized standard for information security management. This accomplishment underscores our commitment...
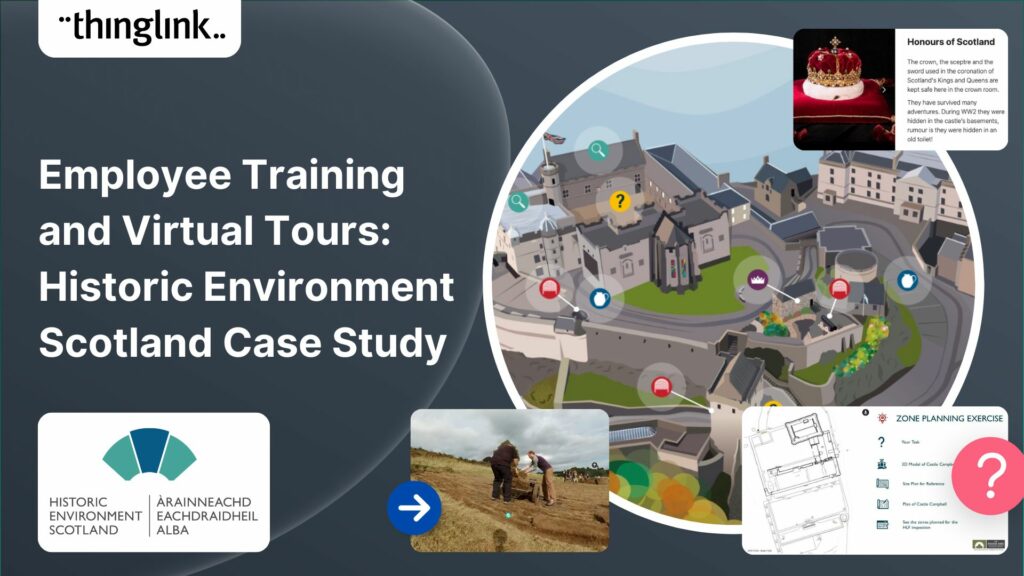
Caring for Scotland’s Heritage Historic Environment Scotland (HES) was formed in 2015 when Scottish Government agency Historic Scotland merged with the Royal ...
 Kyla Ball
9 min read
In 2023, we launched an exciting group of webinars, to engage with ThingLink creators and explore how AI could be integrated into their work. ThingLink Founder ...
This case study features Rachel Silverman, a talented secondary English language arts teacher from Phormes Education in Germany. Rachel is a passionate advocate...
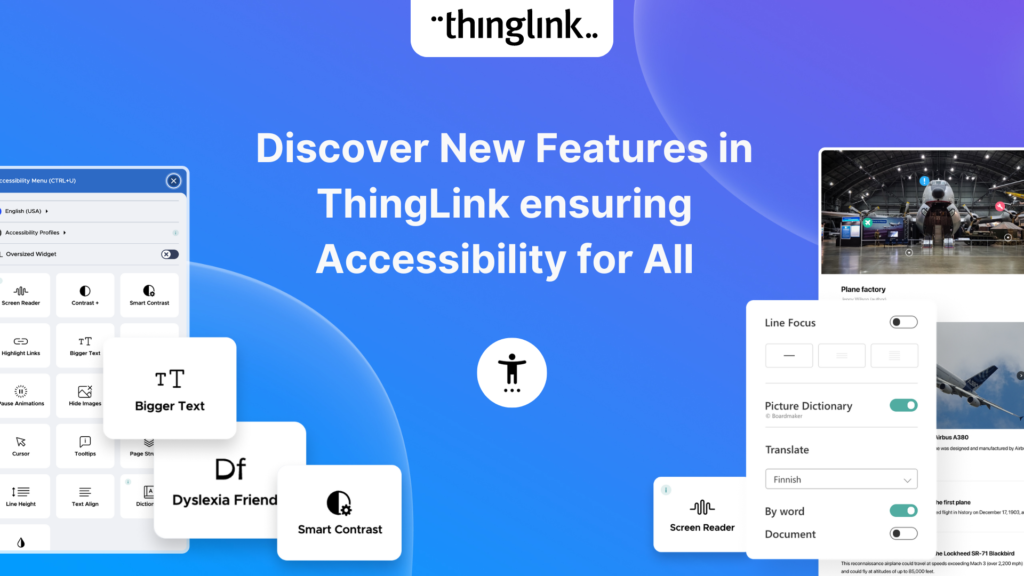
Creating accessible learning experiences is critical for educators, trainers and student creators, but it need not be daunting! ThingLink is a platform that allows...
Creating accessible online course content is critical for educators, trainers and content creators, but it need not be daunting! ThingLink is a platform that allows...
Our team is excited to be back at ISTE, and we look forward to reconnecting with old friends and meeting new ones in Denver, Colorado! Here are some topics and ...
If you’re heading out on an educational trip this end of term, don’t forget your 360 camera to ensure you can re-create the trip as a virtual tour. ...
 Kyla Ball
3 min read
Creating compelling prompts for your immersive 360-degree AI-generated images requires descriptive language that captures the scene’s essence and style as...
Finding engaging and effective methods to train employees is crucial for both individual skill development and team cohesion in any organisation. An escape room...
 Kyla Ball
7 min read
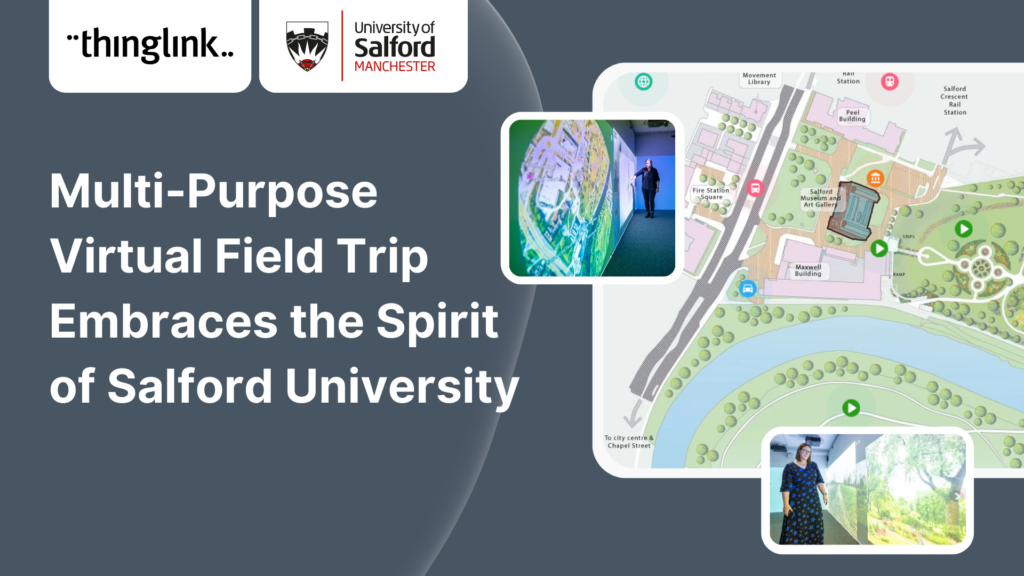
In this case study we look at an inspiring example of collaboration between a university and its local community. The university has created a multi-purpose interactive...
 Kyla Ball
6 min read
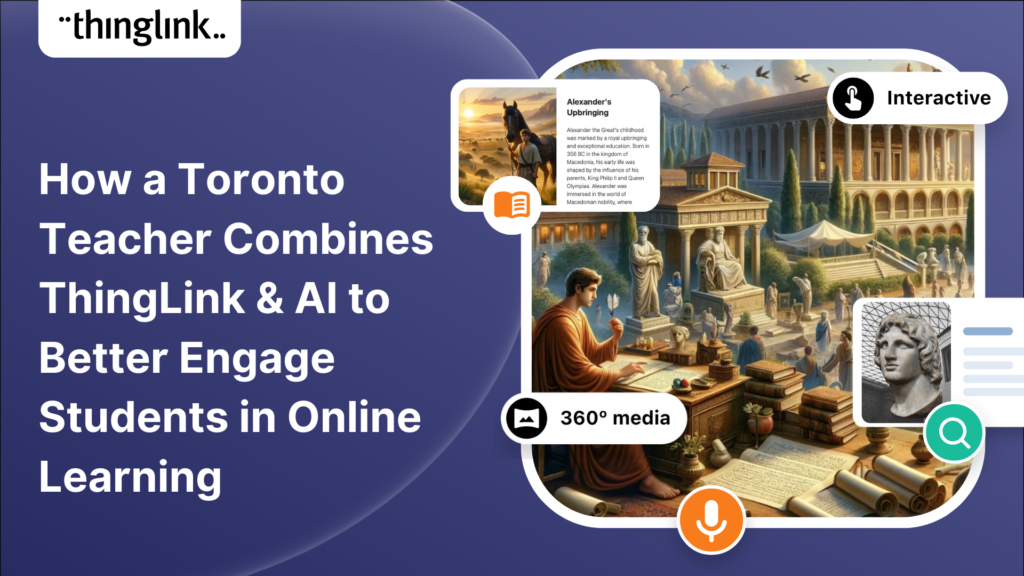
In this case study we are showcasing the inspiring work of Toronto teacher and ThingLink creator Joseph D’Aquila. Joseph’s creative use of AI tools and ThingLink...
 Kyla Ball
4 min read
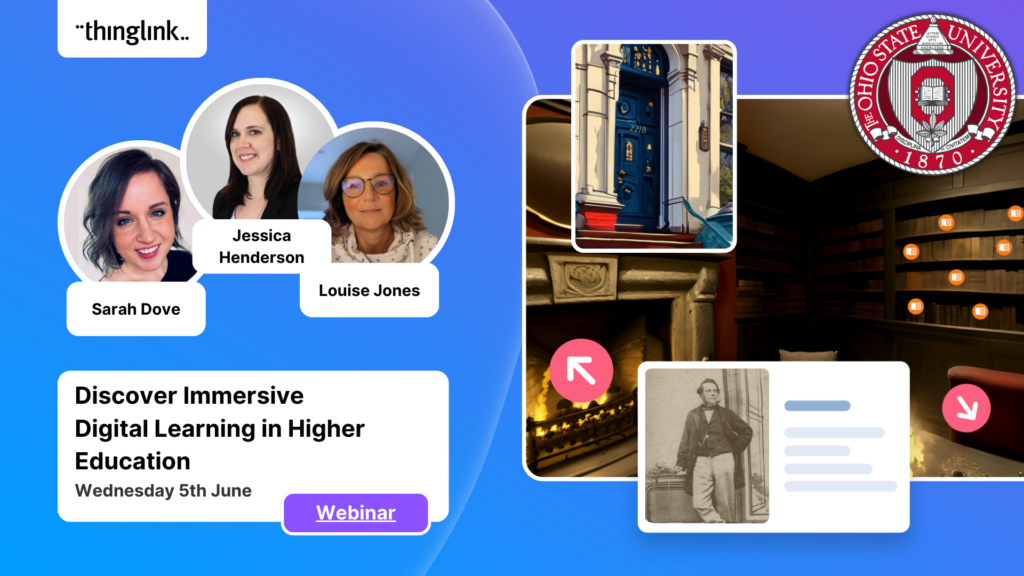
Are you an educator, instructional designer, or higher education professional seeking innovative ways to engage your students? Our upcoming webinar, “Discover...
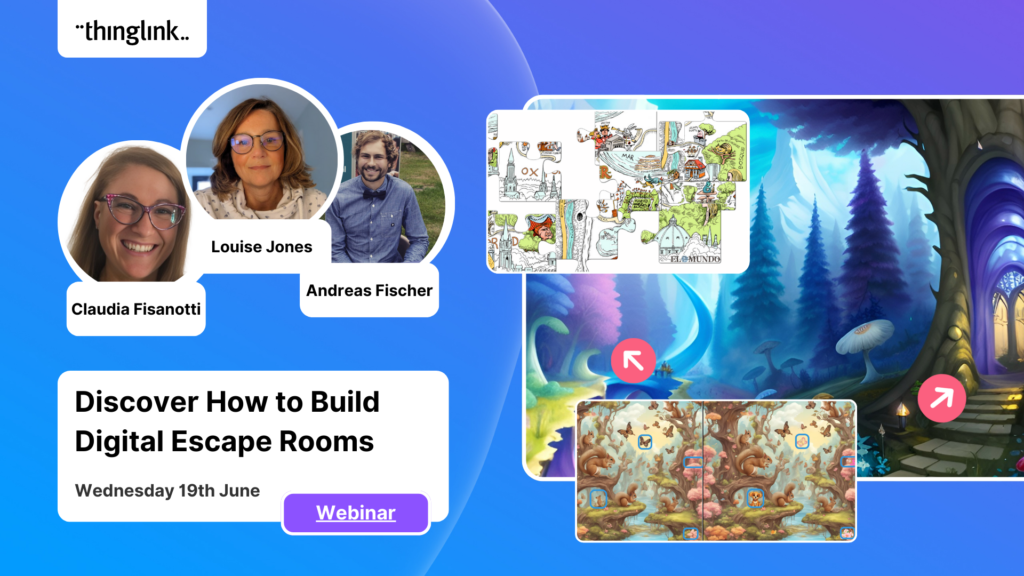
Are you an educator, corporate trainer, or just someone passionate about innovative immersive learning experiences? Our upcoming webinar, “How to Build Digital...
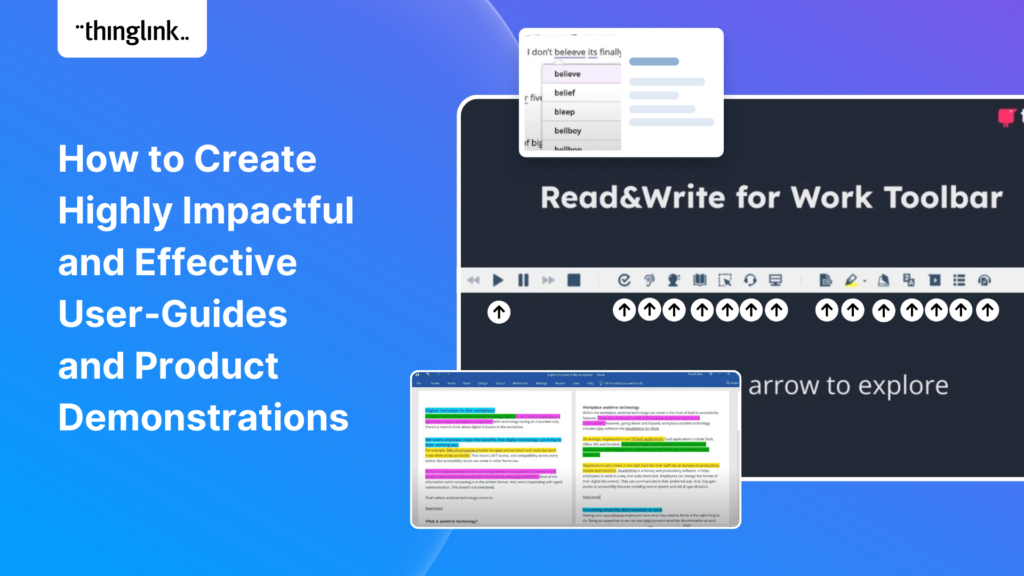
Optimize Your User Guides or Product Marketing Strategies with Interactive Product Demonstrations Using ThingLink Capturing your target audience’s attention...
Sabine Römer and Sarah Görlich are part of the e-learning department at the Ruhr University in Bochum, Germany. Together, they form a dynamic partnership that...
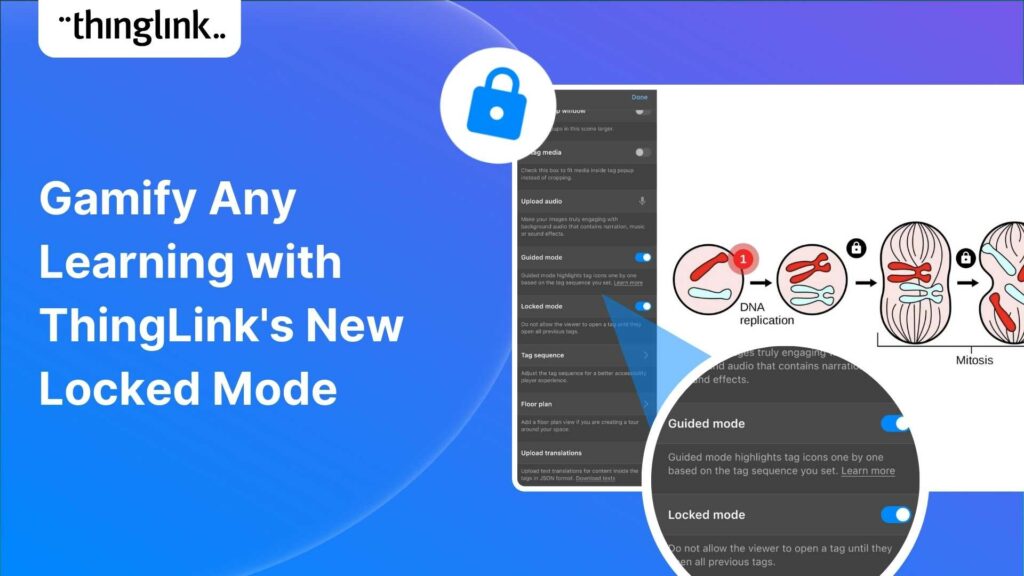
Creators can now enable new Locked Mode for tags, allowing learners to unlock new information as they progress through a scene in a set sequence. In this post we’ll...
 Kyla Ball
4 min read
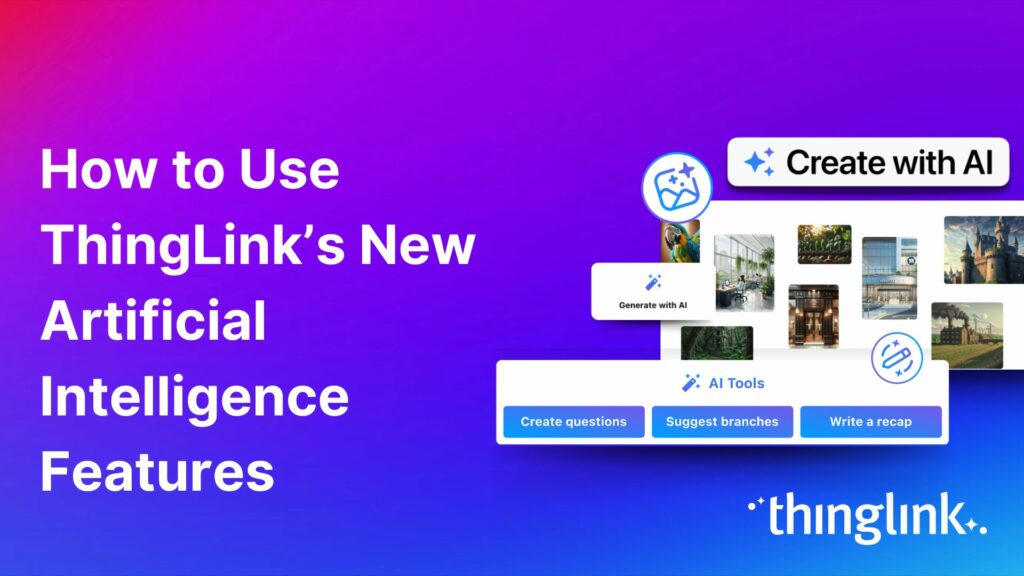
All ThingLink accounts will now include AI-powered tools (with controls) to enable educators and learners to generate images to use with the ThingLink editor. Effective...
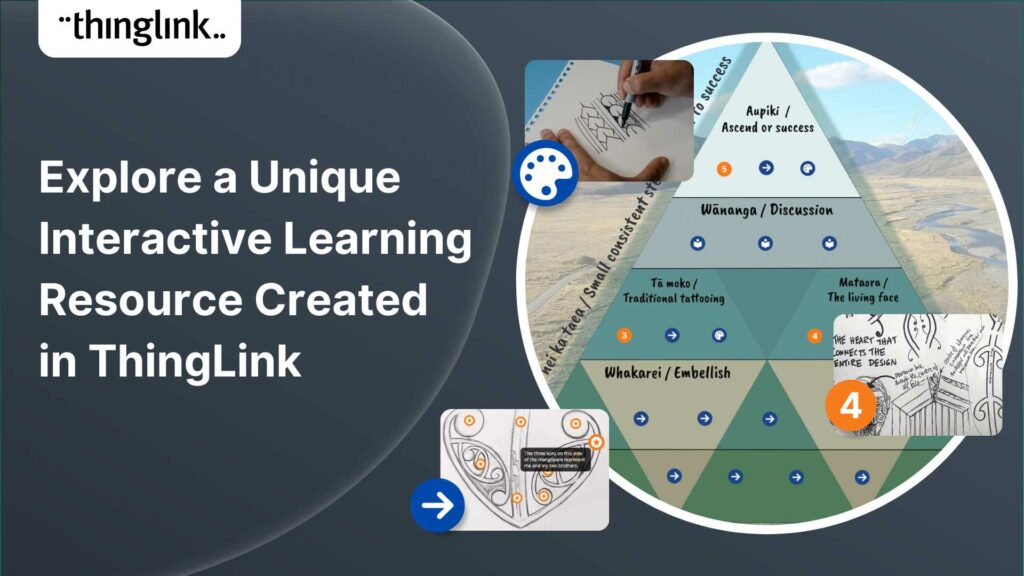
Katrina Lilly is a teacher at Te Aratai College in New Zealand, and recently finished a Masters in Contemporary Education at AcademyEx. As part of her masters she...
 Kyla Ball
6 min read
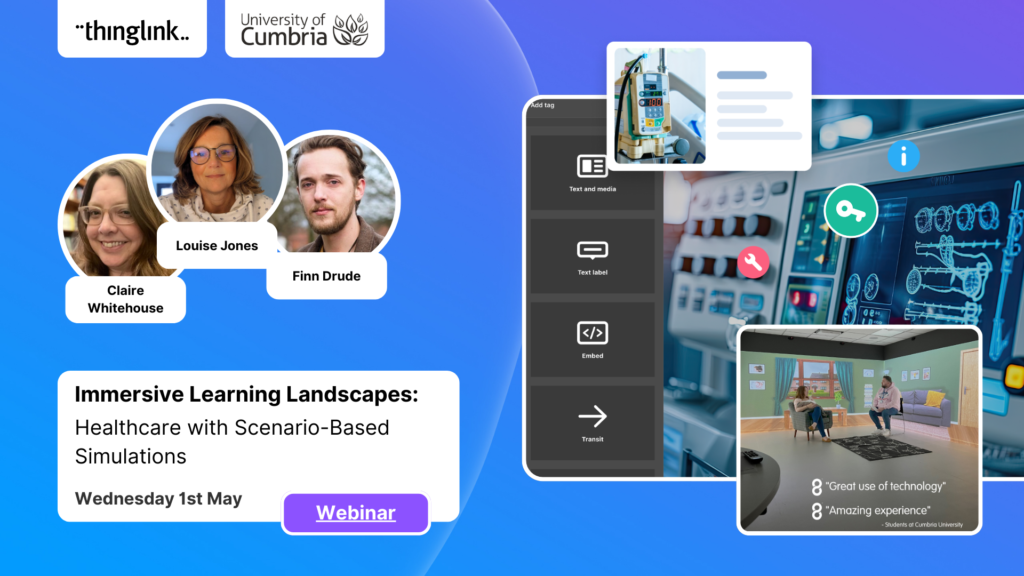
ThingLink has become an essential tool across numerous industries, making the learning experience more relevant and relatable at every stage. The impact in healthcare...
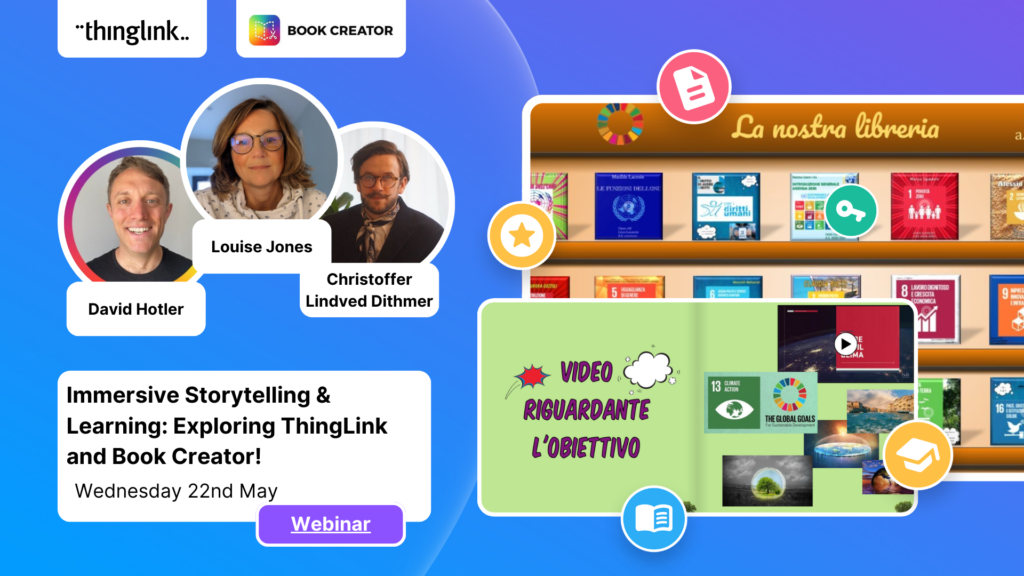
Update! This webinar is truly unmissable! Sign up to receive the recording to see how Christoffer inspired everyone with his amazing presentation and live demonstrations....
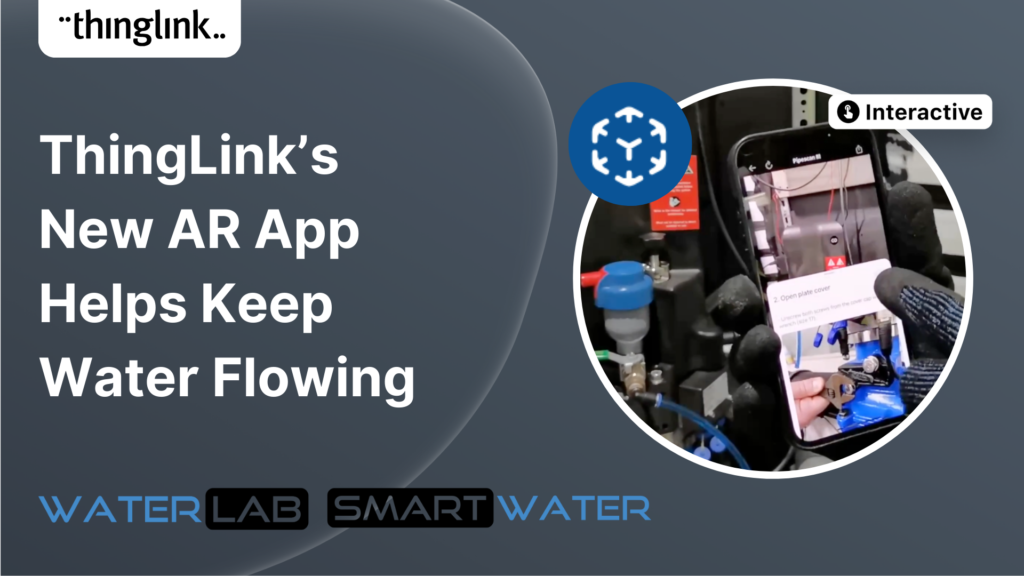
ThingLink’s AR Solution Helps Operators Troubleshoot Critical Water Network Issues Clean, safe water on demand is a fundamental expectation and mainstay...
 Kyla Ball
7 min read
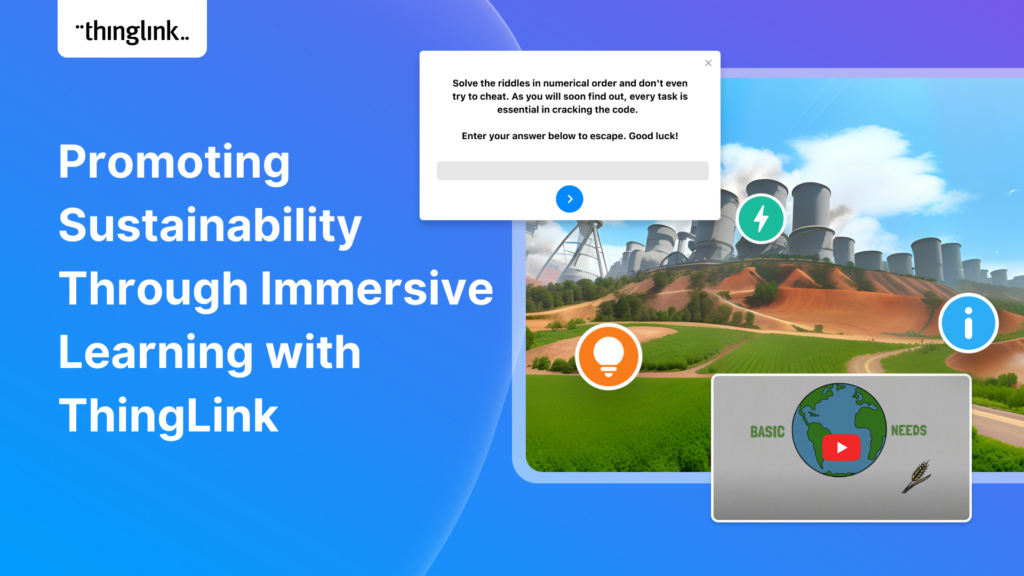
The world faces numerous sustainability-related challenges, threatening the future of our planet. Those issues are often hard to grasp without direct exposure to...
Now On-Demand! ThingLink is absolutely thrilled to present an exclusive webinar titled “From EdTech to PedTech: The Pedagogical Power of an Immersive Experience.”...
Discover the future of nursing education with the “Care for Europe” project, where immersive tours and interactive modules seamlessly prepare students...
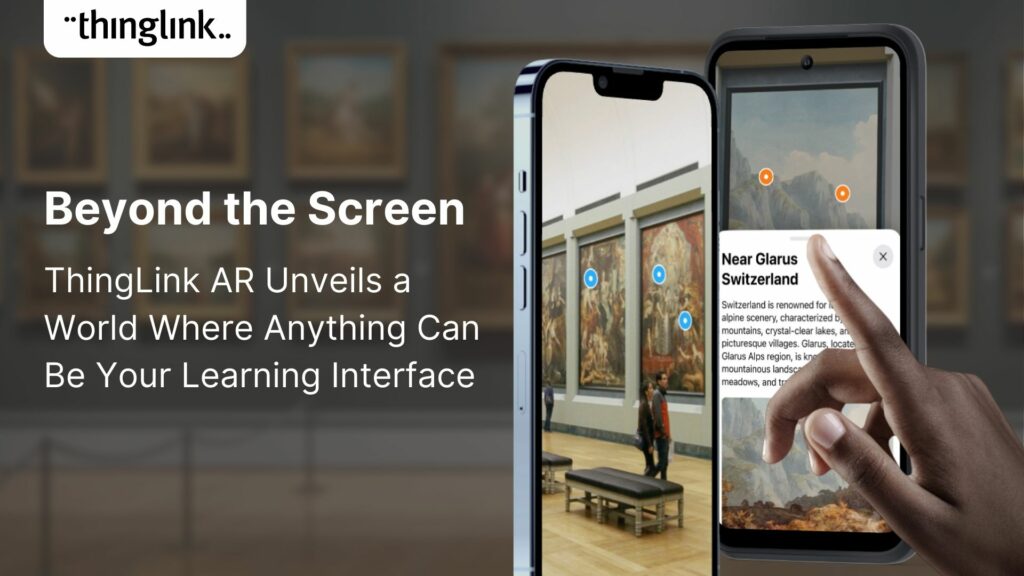
💡 ThingLink Launches their AR Solution: Augmented Reality Simplified for All 📱 Breathe life into the ordinary with ThingLink’s brand new Augmented Reality...
We are delighted to invite you to our webinar! ThingLink Host Louise Jones welcomed special guest star Jon Neale from Quizizz for a fun discussion and live demonstration...
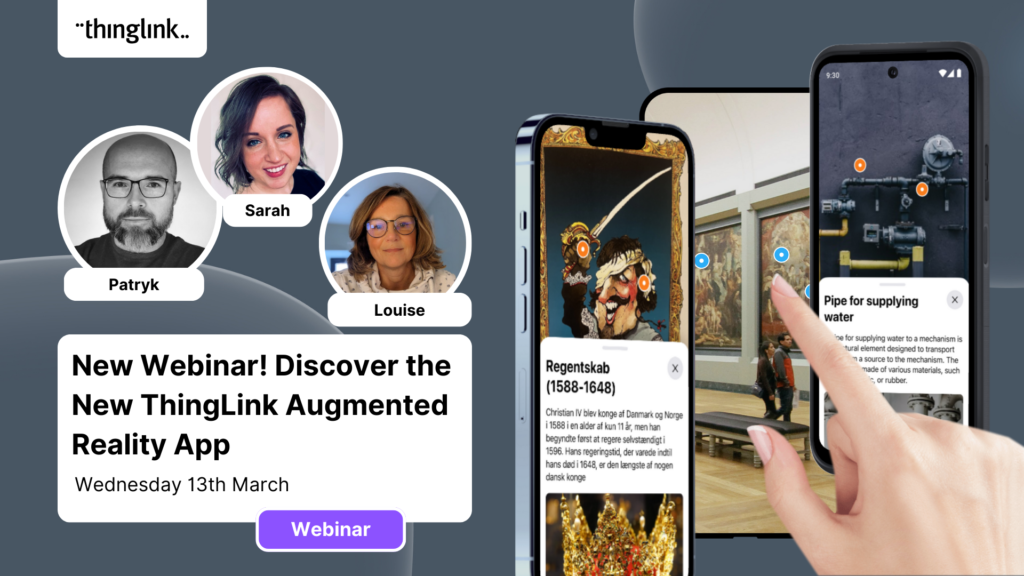
Discover the new ThingLink Augmented Reality App! In this exclusive free webinar Louise from ThingLink is joined by Special Guests Patryk Wójtowicz, Savonia University...
Scalable XR Project, spearheaded by ThingLink Oy, embarks on a transformative journey to redefine the landscape of XR technology in learning and development. This...
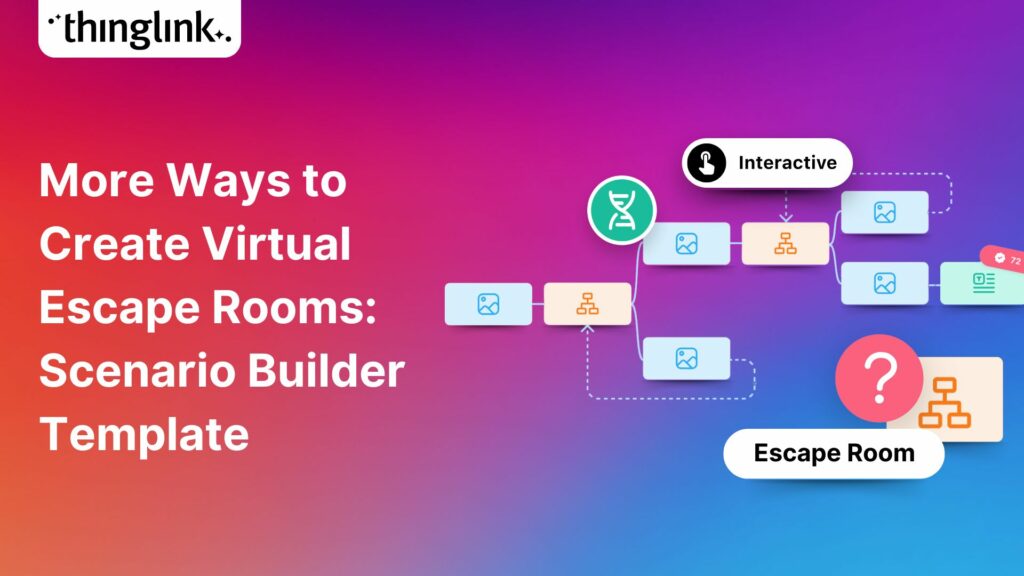
Creating a Virtual Escape Room is now even easier with ThingLink’s Scenario Builder ready-made template! Escape rooms (sometimes called breakout rooms) have...
 Kyla Ball
4 min read
What a webinar! “Discover Immersive Learning with ThingLink and Adobe Express,” draws upon insights from the recent BETT Education Technology Show. ...
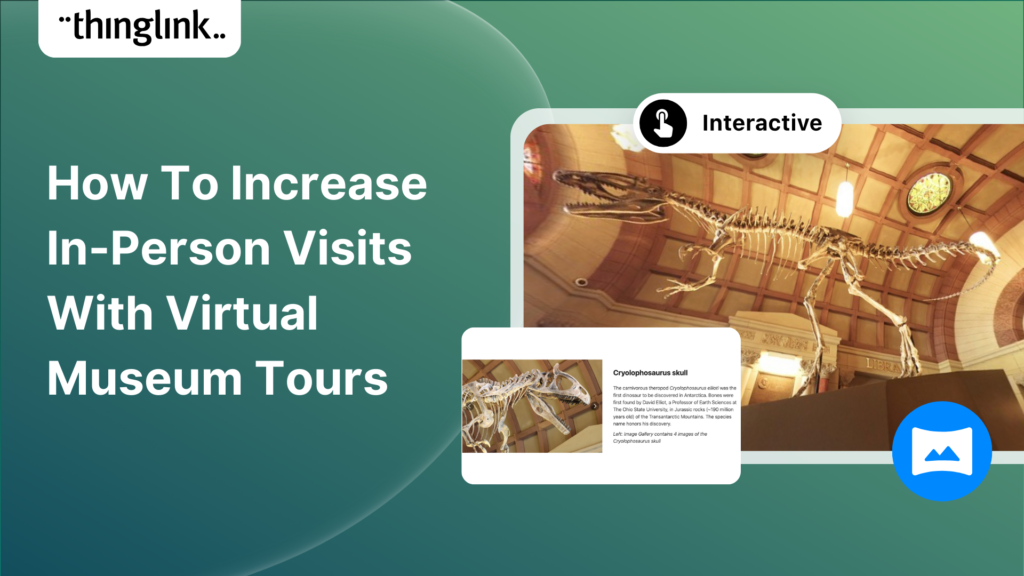
Museums worldwide are finding innovative ways to enhance their visitor experiences both on and offline. One such innovation is the virtual museum tour. Perhaps ...
 Kyla Ball
4 min read
In the fall of 2023, Ohio State University’s College of Arts and Sciences Office of Distance Education (ASC ODE) began a collaboration with the college’s...
 Kyla Ball
6 min read
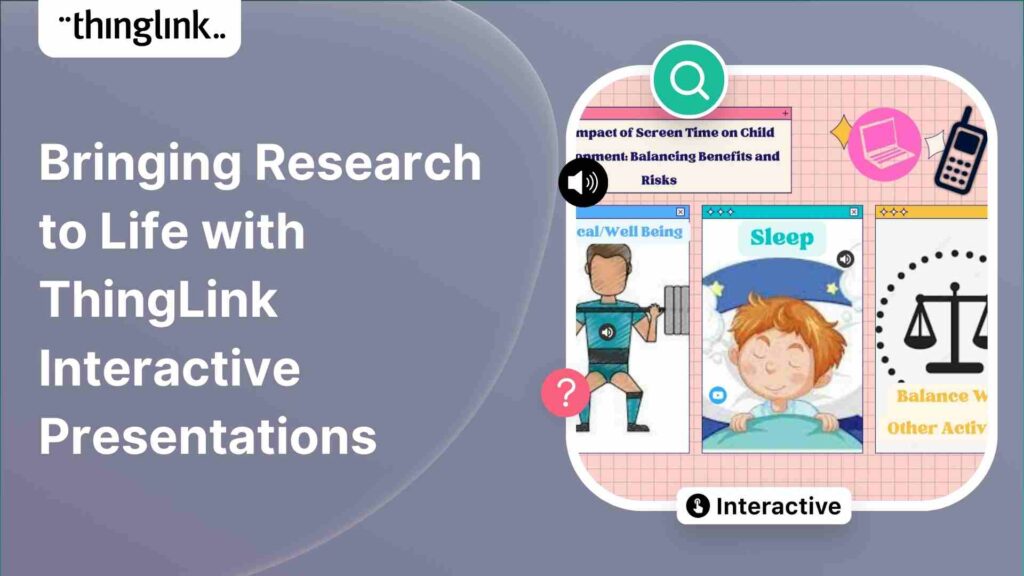
Regardless of subject, presenting your data and findings in an engaging and understandable way can be a challenge! Fortunately, ThingLink provides you with the ...
 Kyla Ball
4 min read
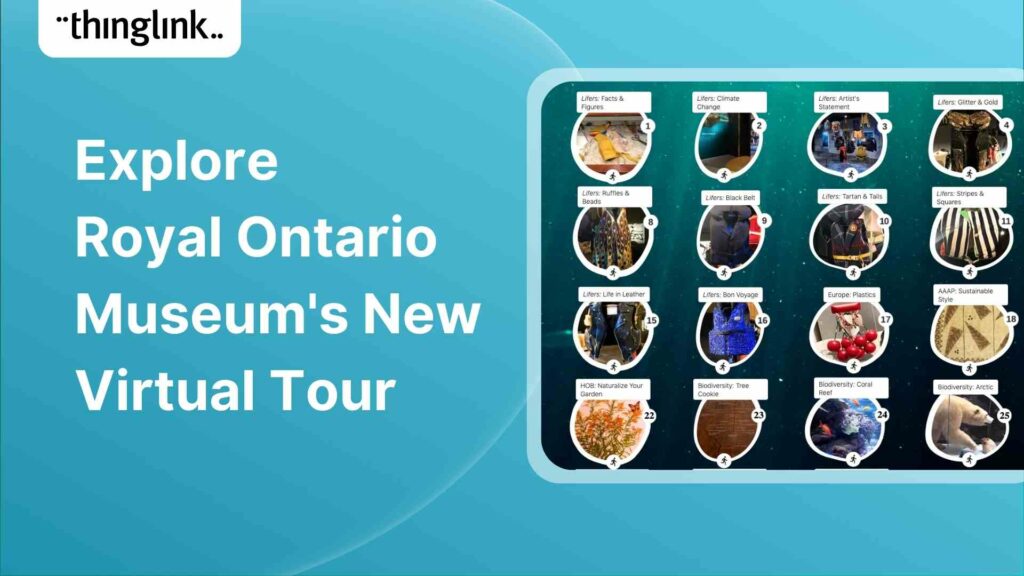
Behind the scenes at the museum Established in 1914 in Toronto, the Royal Ontario Museum (ROM) exhibits global art, culture, and natural history. It’s one...
 Kyla Ball
4 min read
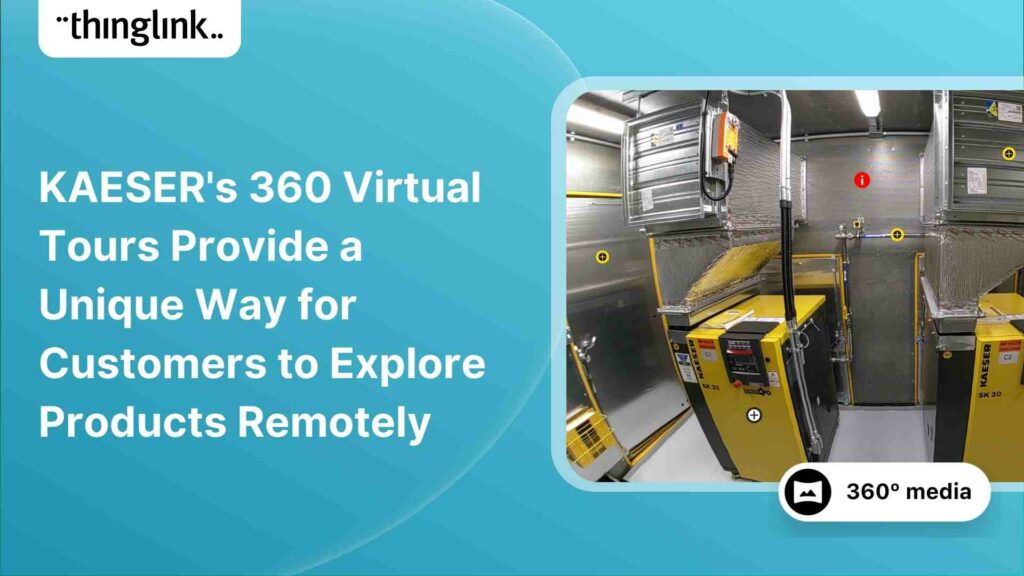
About KAESER KAESER Compressors is one of the world’s leading manufacturers and providers of compressed air products and services. They manufacture compressed ...
 Kyla Ball
3 min read
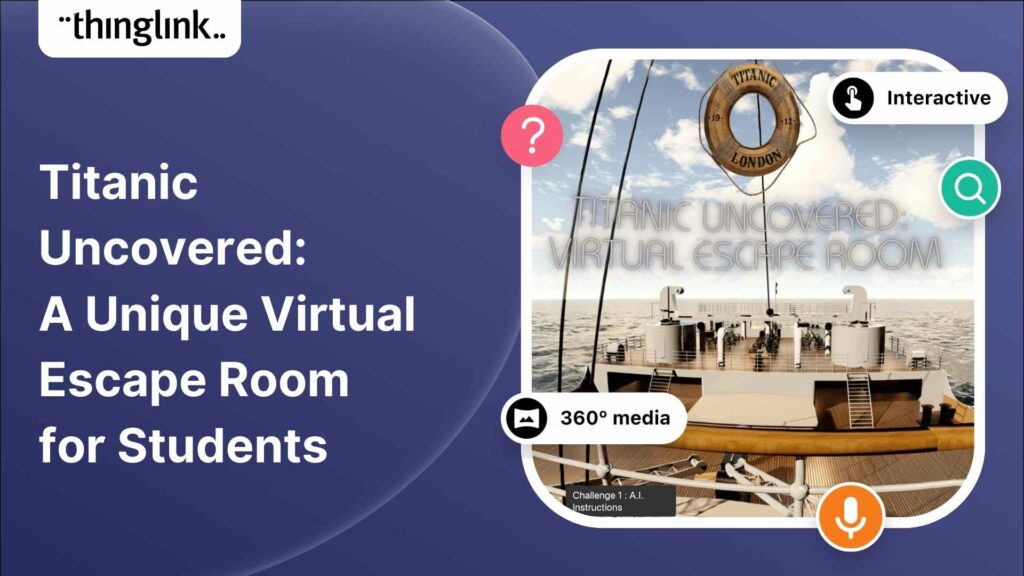
Educator Dwitney Bethel has created an incredible digital escape room using ThingLink’s Scenario Builder, set during the tragic maiden voyage of the Titanic...
 Kyla Ball
8 min read
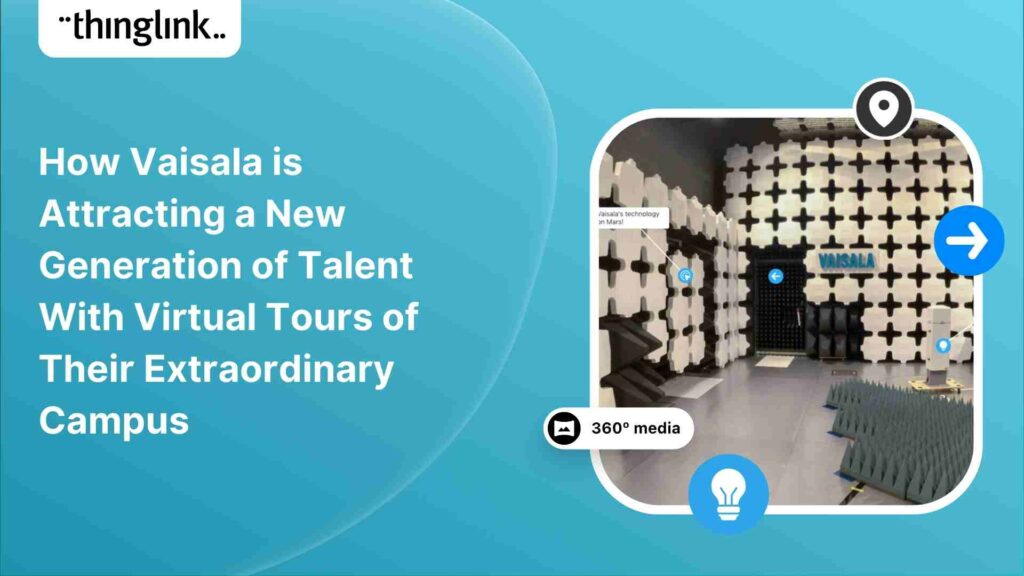
In this case study we look at how a global leader in weather and environmental measurements has opened up its incredible new R&D center and some of its other...
 Kyla Ball
6 min read
ThingLink was honored to be named as Top Extended Reality XR Firm at the European Metaverse Awards. A record 123 top companies were short-listed as finalists in...
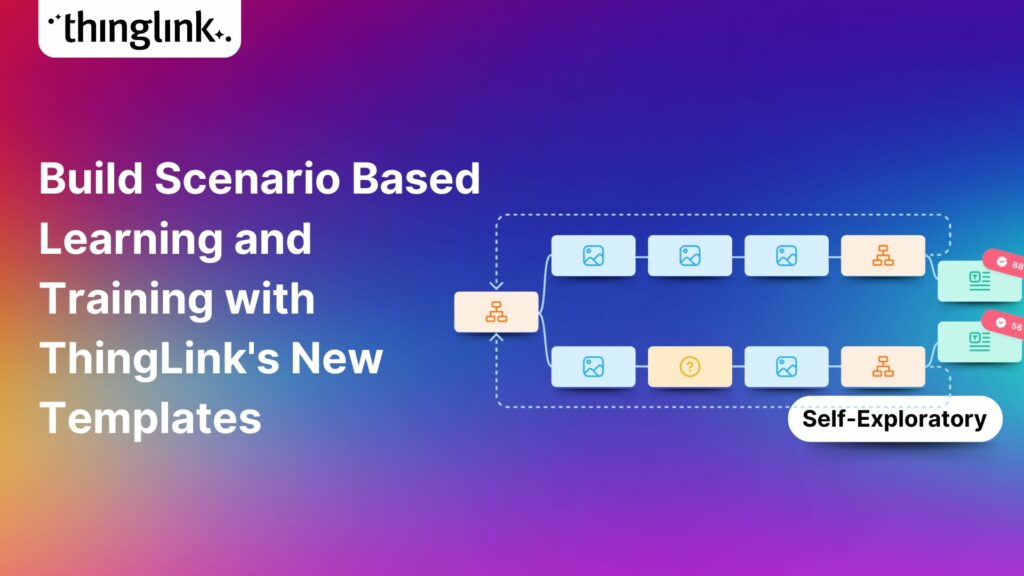
Start creating your interactive online courses and modules with ThingLink’s Scenario Builder templates In the age of eLearning, many educators and corporate trainers...
 Kyla Ball
5 min read
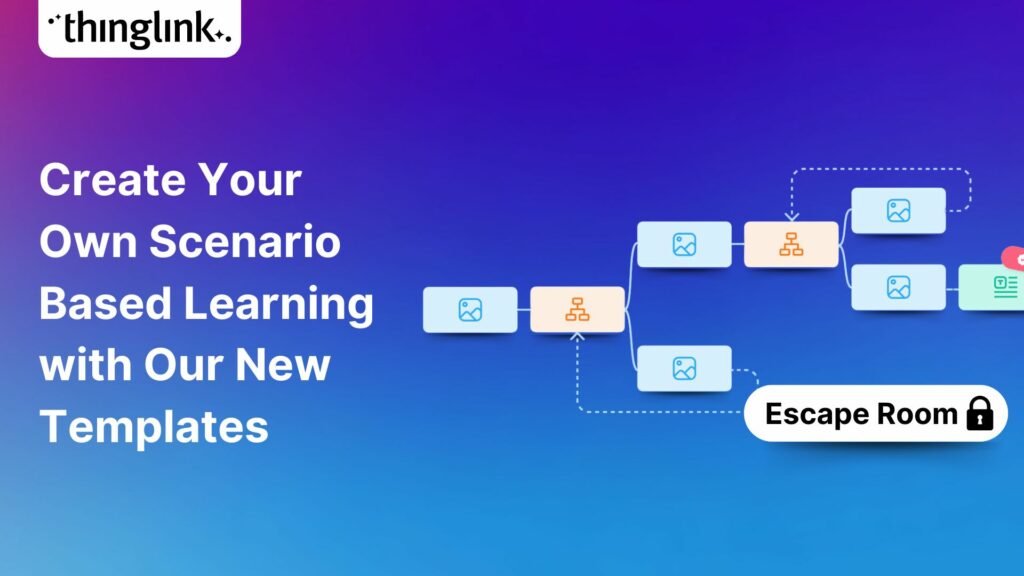
Creating an online course or module is now easier than ever using ThingLink Scenario Builder templates In the world of elearning and corporate training, creating...
 Kyla Ball
5 min read
