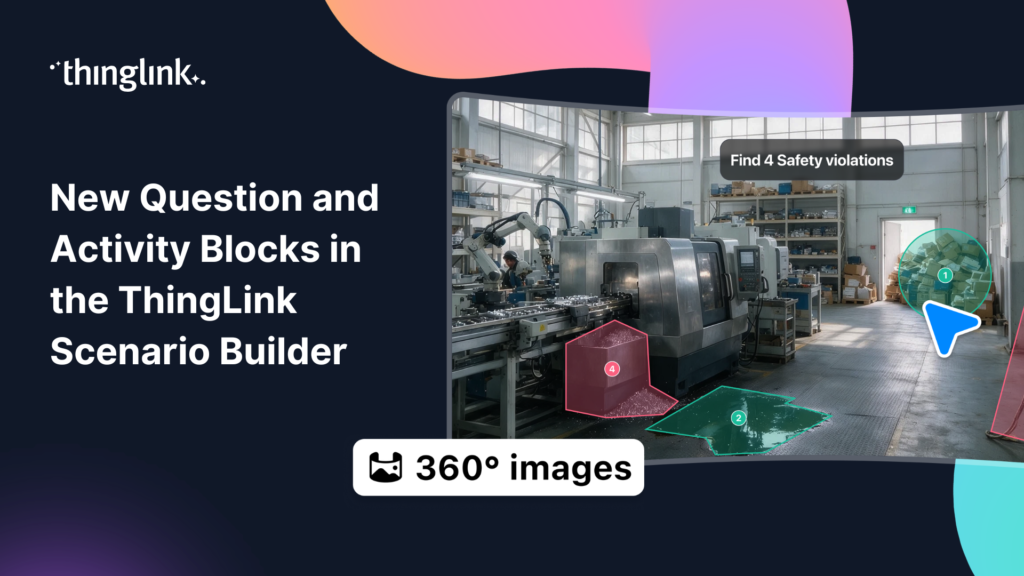
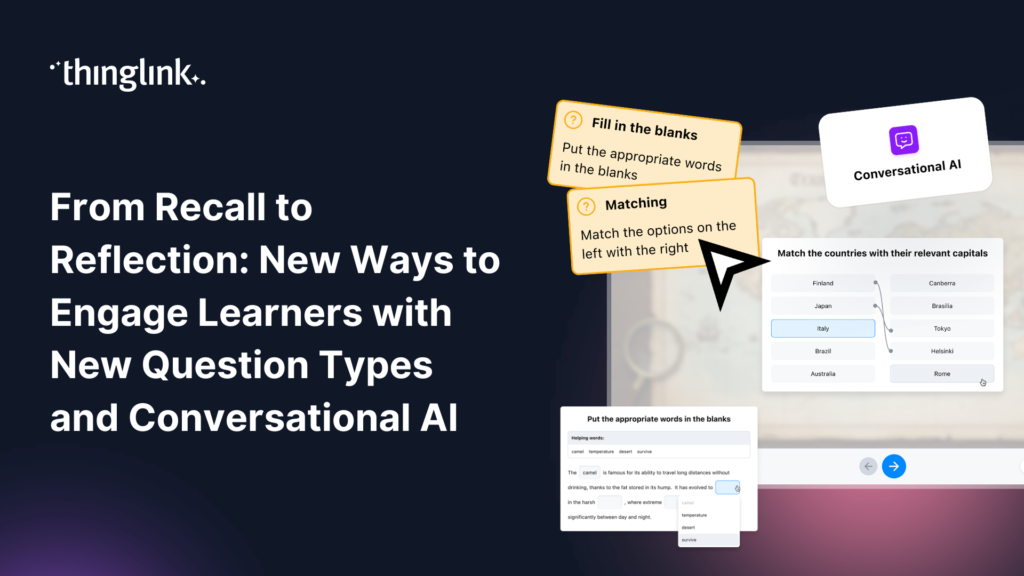
ThingLink Scenario Builder now includes an expanded range of Question and Activity blocks, giving creators more ways to collect learner responses and build interactive...
Your new hire logs in on their first day. They receive a PDF handbook, a slide deck, and a calendar full of video calls. By lunchtime, they are overwhelmed. By ...
 Kyla Ball
4 min read
Kyla Ball
4 min read
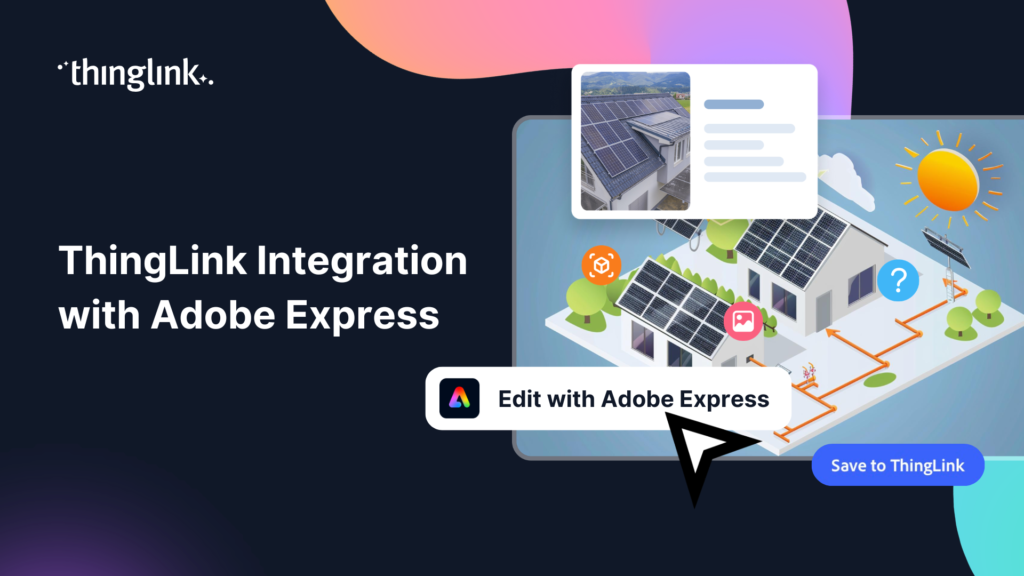
We’re thrilled to announce a brand-new integration between ThingLink and Adobe Express, making it easier than ever to design stunning visuals and turn them...
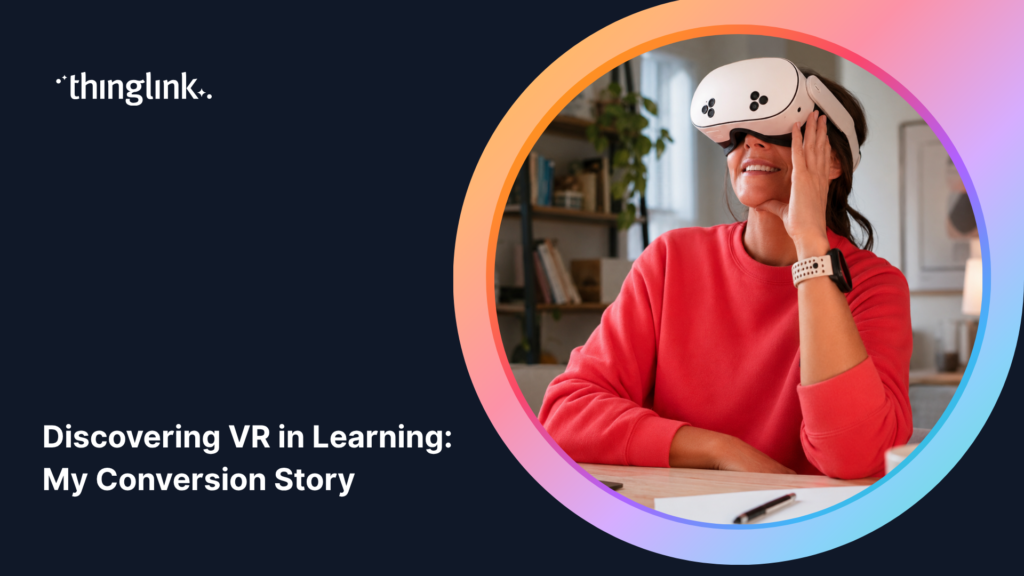
I’ll Be Honest: I Used to Keep VR at Arm’s Length If you have ever felt slightly suspicious of VR headsets in education, or thought they were a bit ...
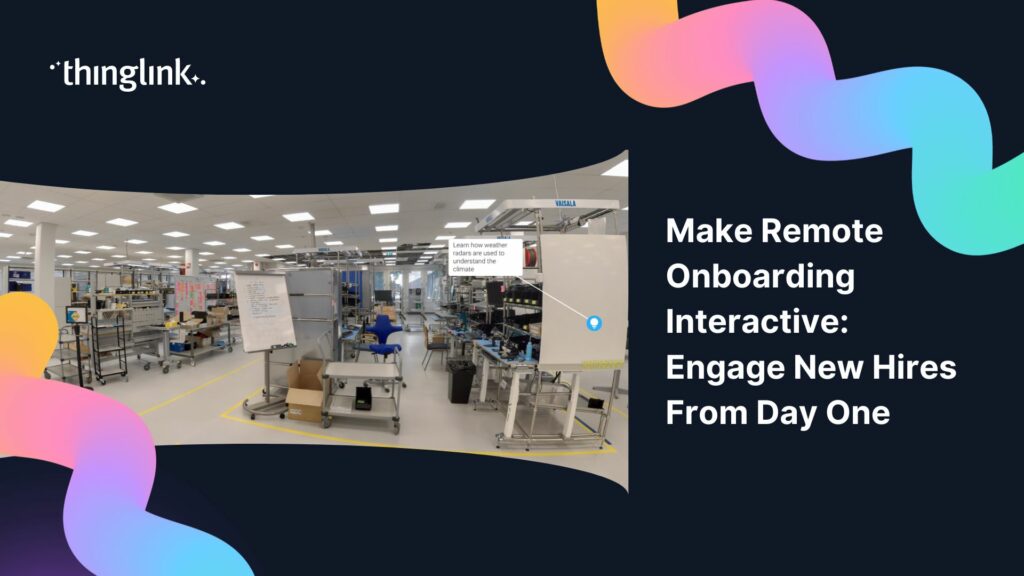
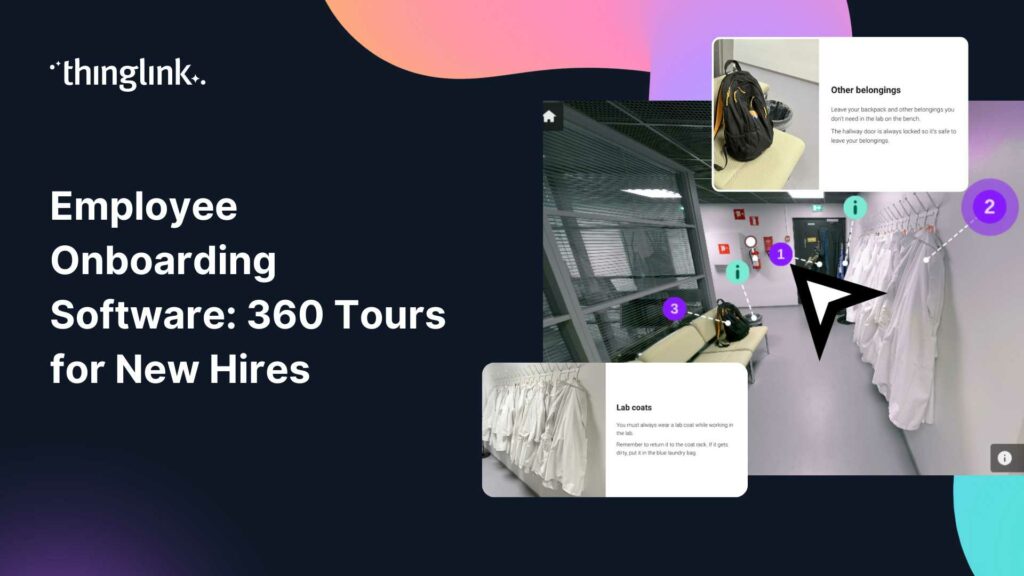
Your new hire’s first day shouldn’t be the first time they see your workplace. By the time someone walks through the door, they’re already managing...
Kyla Ball
5 min read
Your learners are busy. They are balancing targets, deadlines, and back-to-back meetings. And somewhere in between all of that, they are supposed to complete their...
Kyla Ball
5 min read
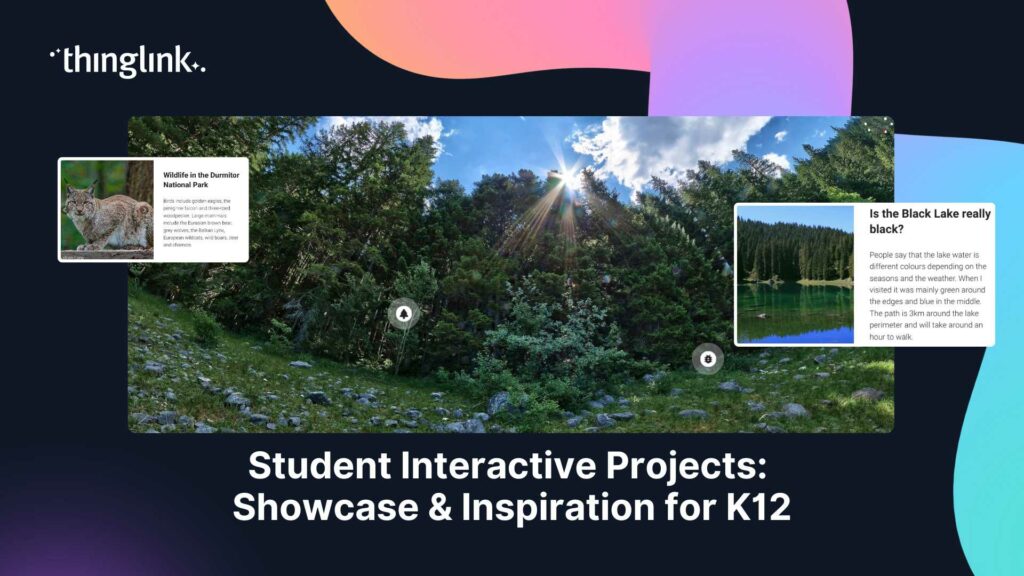
What if your students did not just study a topic, but actually built something with it? Student interactive projects flip the script on traditional assessments....
Kyla Ball
4 min read
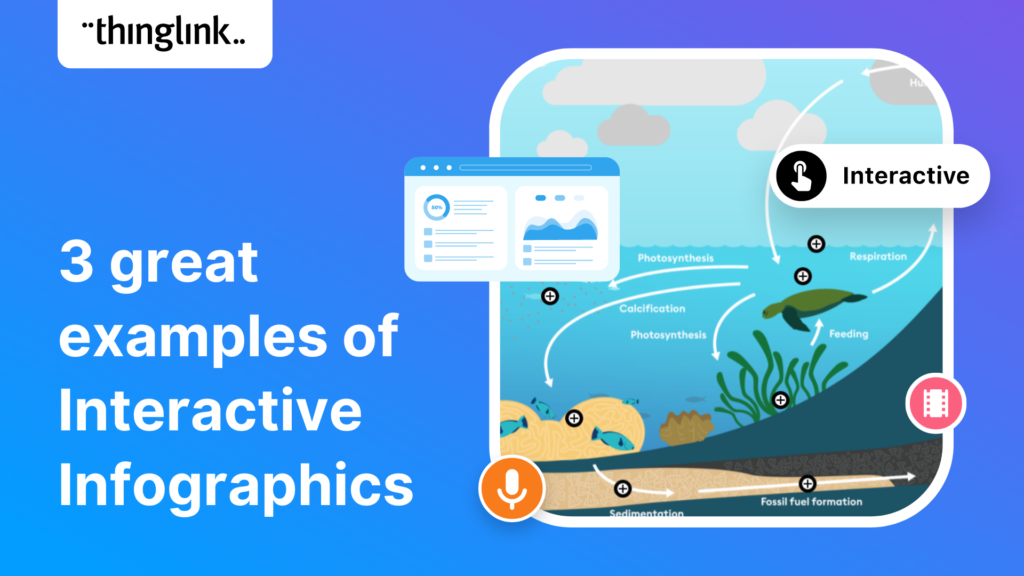
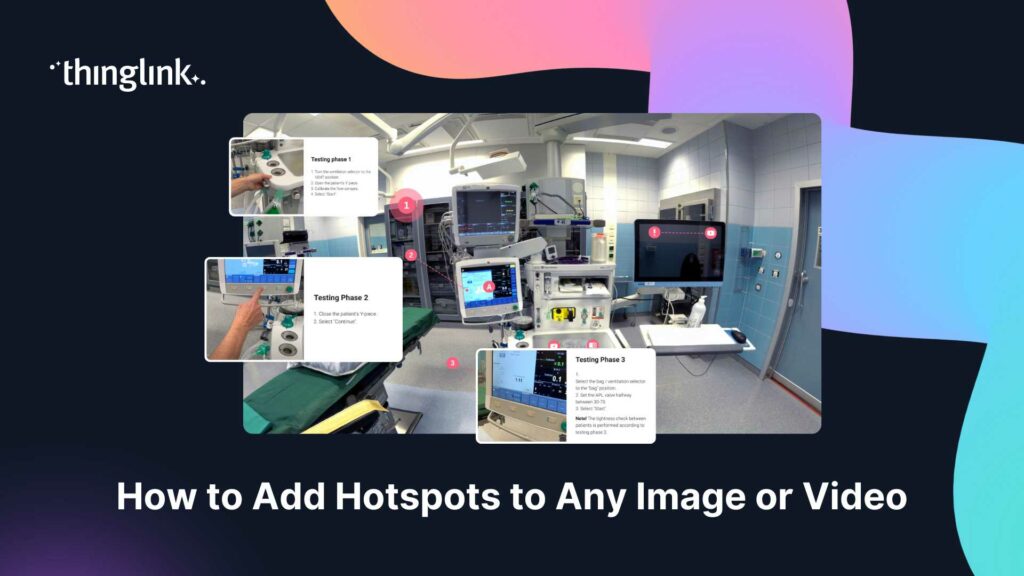
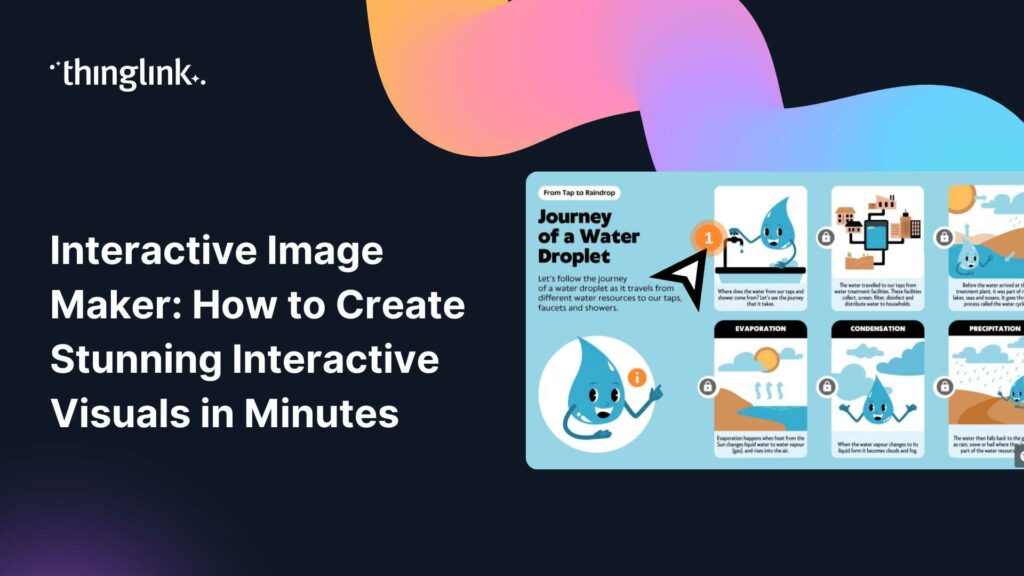
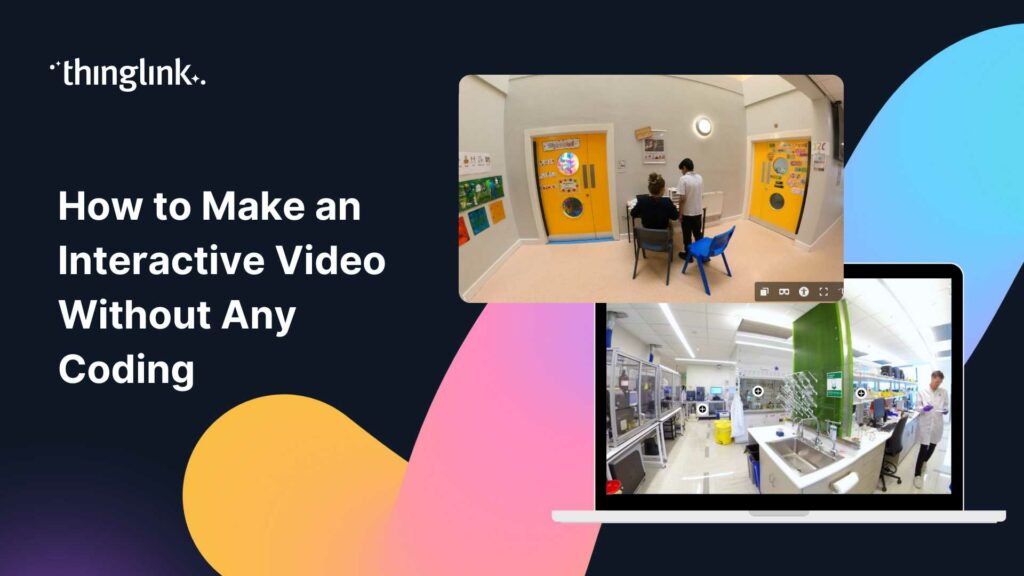
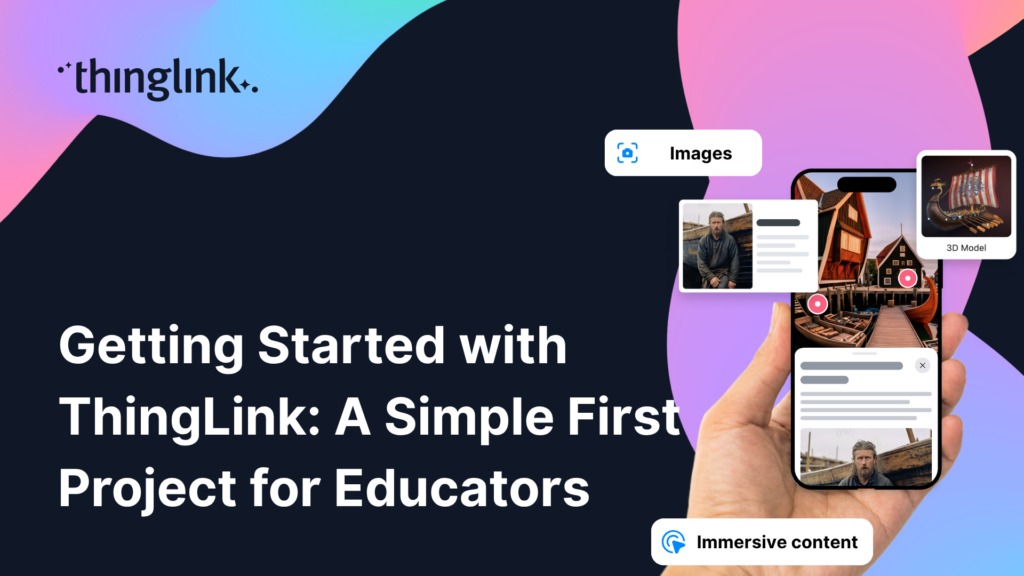
You have a great image or video. You know there is more to say about it. But a static file sitting inside a course or on a webpage can only do so much. What if ...
Kyla Ball
4 min read
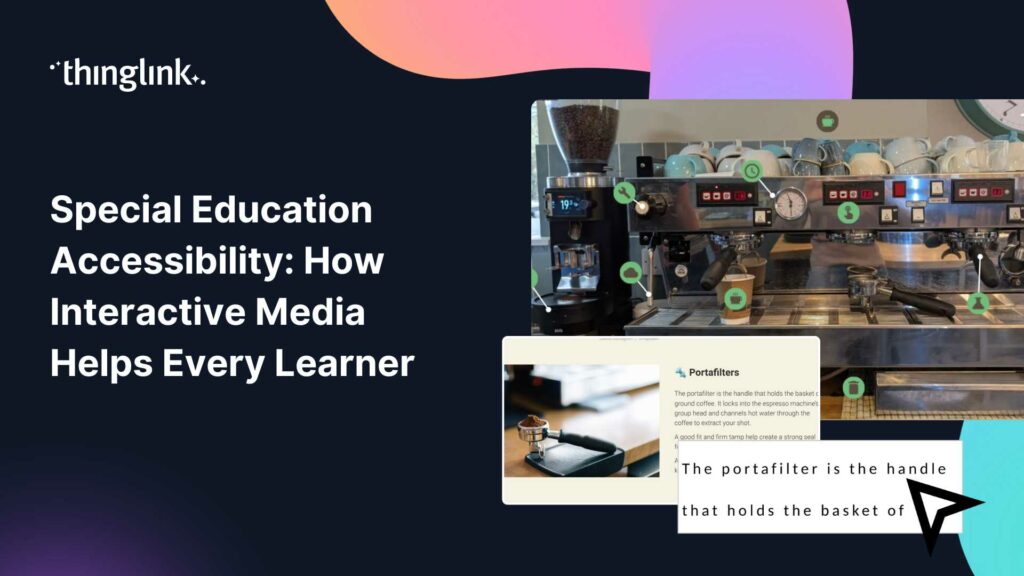
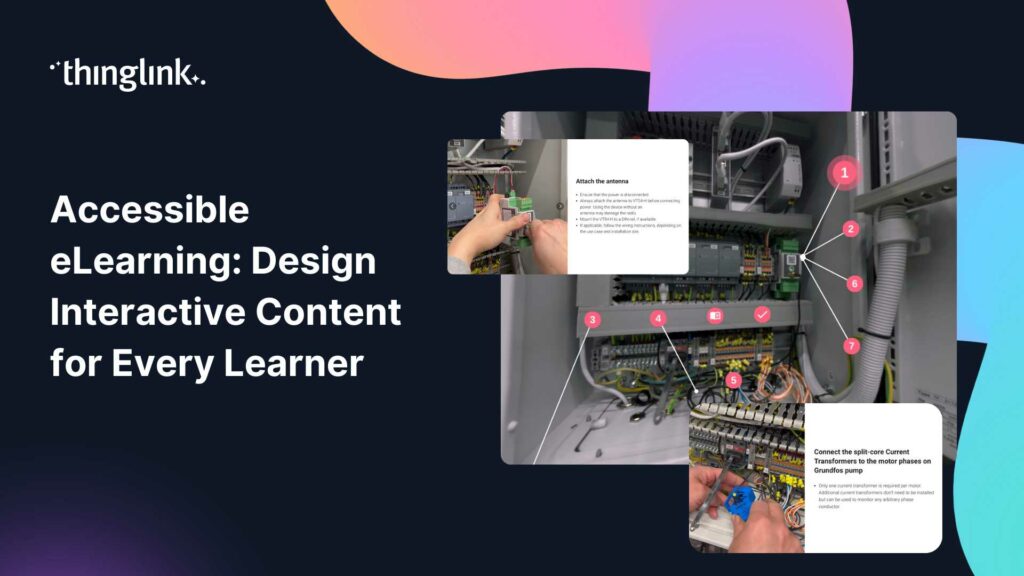
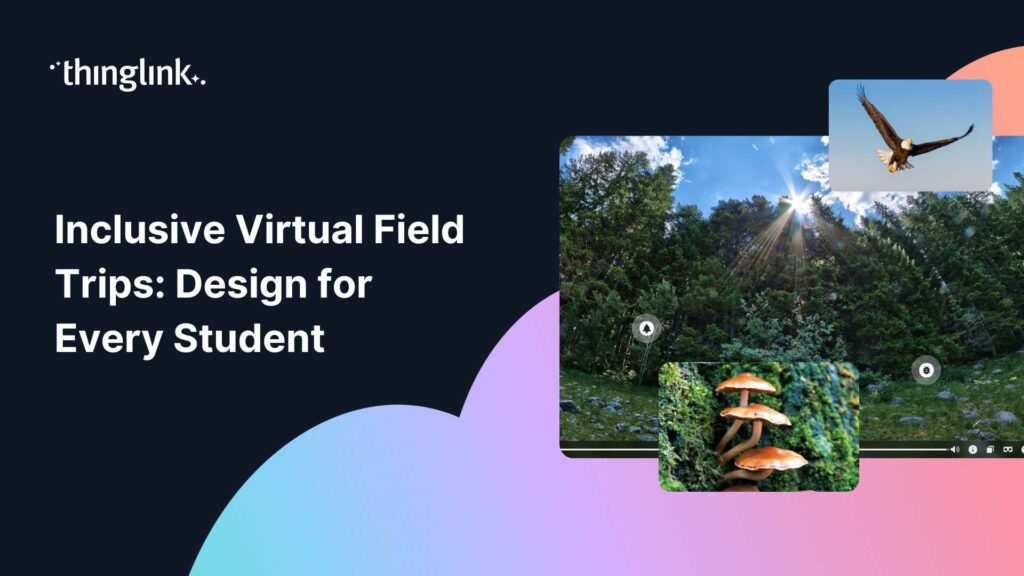
What if every student in your classroom could access the same learning experience, regardless of their communication style, sensory needs, or cognitive profile?...
Kyla Ball
5 min read
You’ve built a beautiful interactive image. Tags are placed, content is layered in, and the learning journey feels intuitive. But here’s the question...
Kyla Ball
5 min read
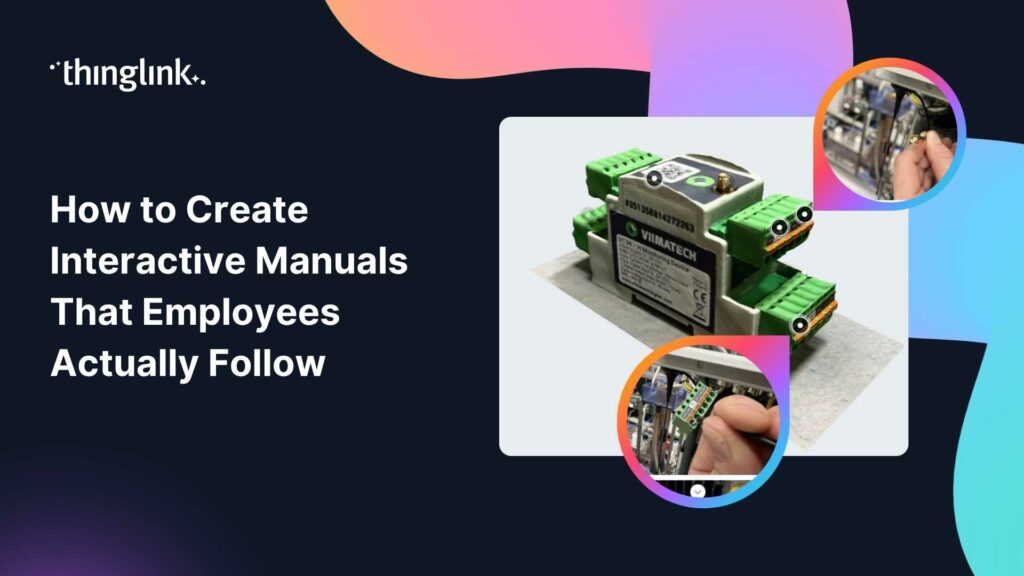
You have printed the procedures. You have uploaded the PDFs. You have added the laminated cards near the equipment. And yet, workers still do the task their own...
Kyla Ball
3 min read
What if your most important compliance training module was completely invisible to 20% of your workforce? Not because they skipped it, but because the format itself...
Kyla Ball
5 min read
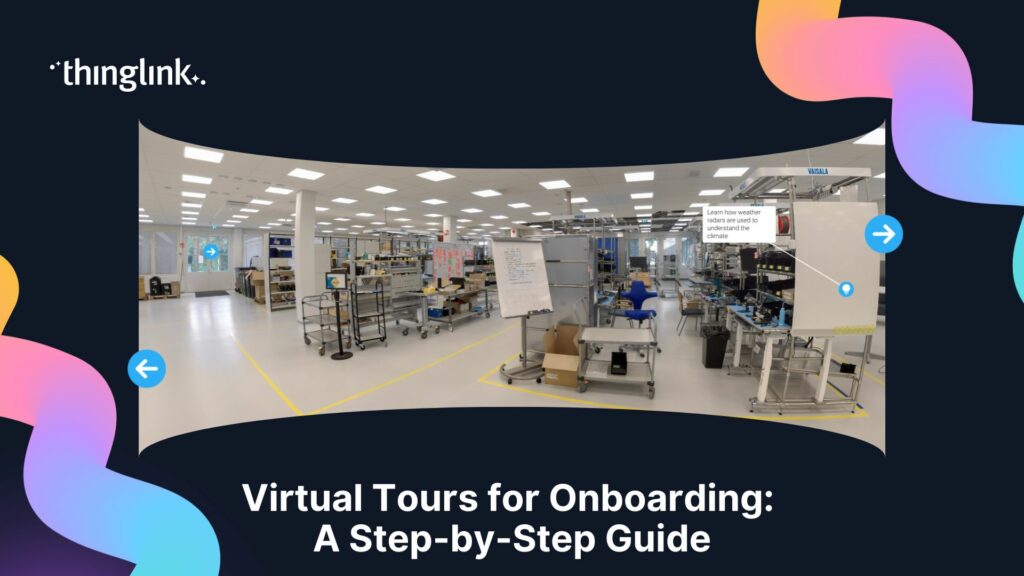
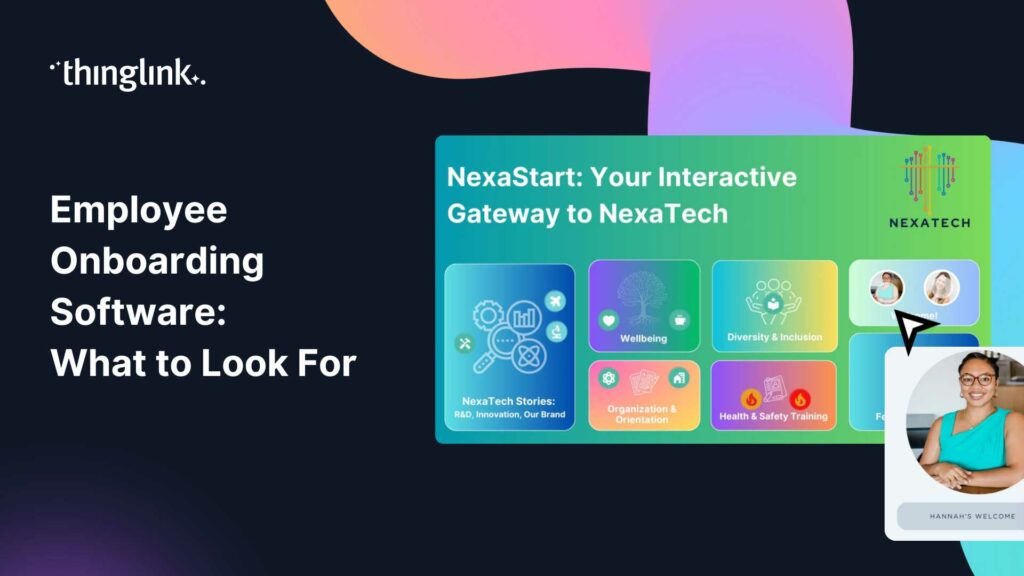
Your new hire has signed the contract. Now comes the part that shapes everything: onboarding. Research consistently shows that the first weeks in a role have an...
Kyla Ball
5 min read
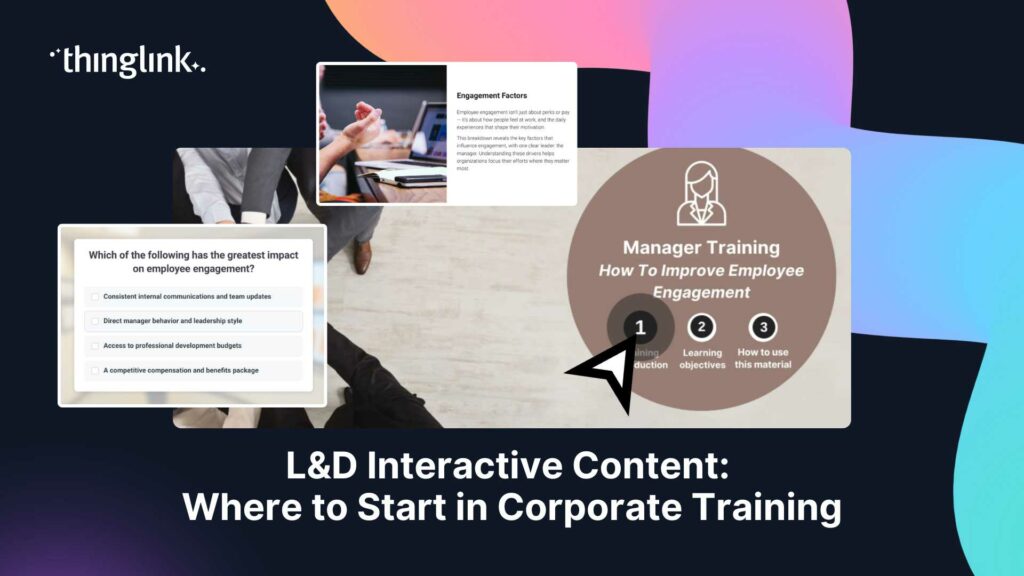
Your team completed the compliance module. They passed the quiz. Three weeks later, they freeze on the job. Sound familiar? If you lead learning and development,...
Kyla Ball
5 min read
You have a great image. Maybe it’s a product shot, a training diagram, a trade show graphic, or a customer education visual. But static images only go so ...
Kyla Ball
4 min read
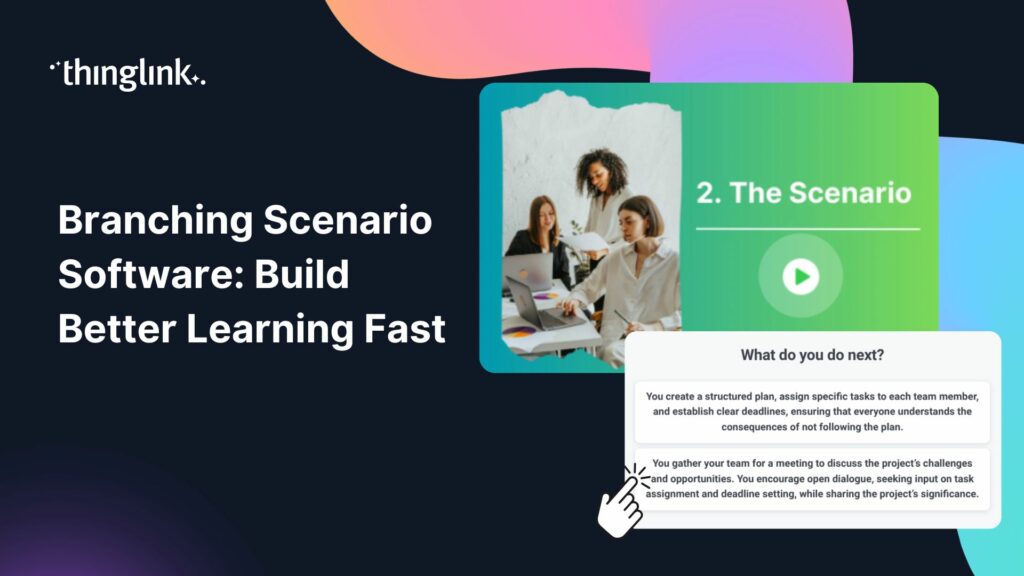
Your learners are sitting through another slide deck. They click through, they score 80% on the quiz, and two weeks later they cannot recall a single decision they...
Kyla Ball
5 min read
Are Your Visitors Truly Engaged, or Just Present? There is a difference between a visitor who walks through your galleries and one who connects, questions, and ...
Kyla Ball
4 min read
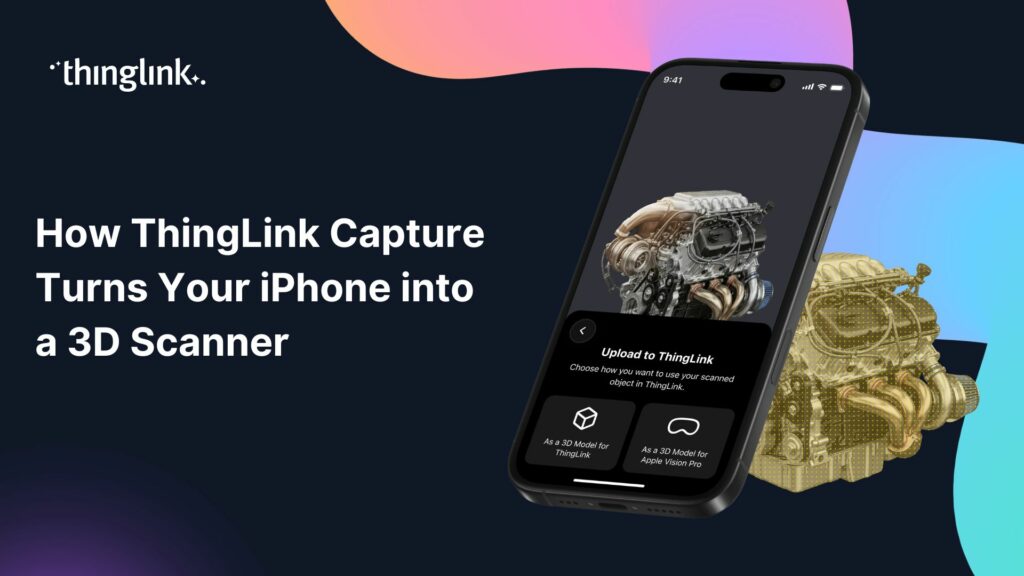
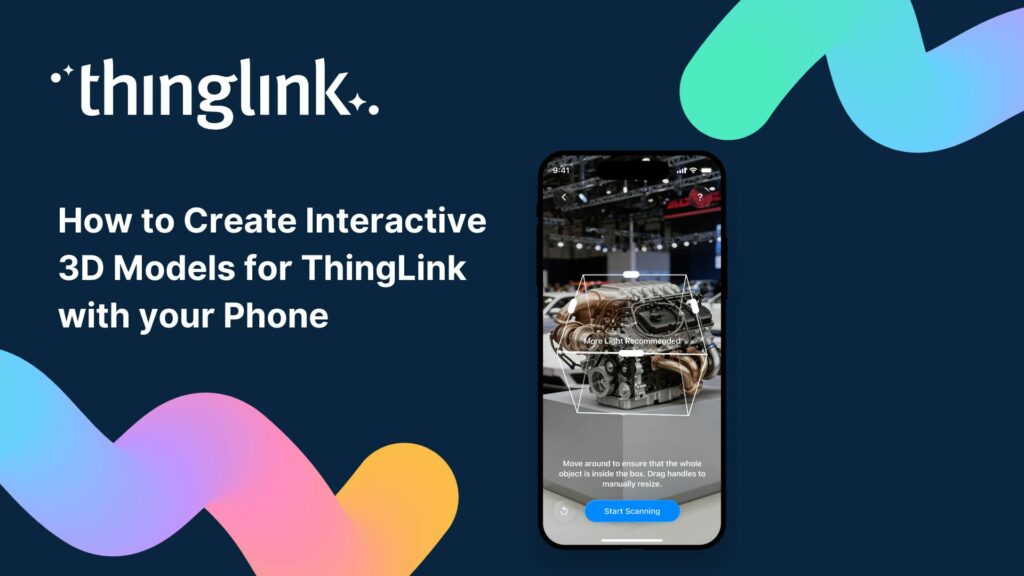
What if the most powerful 3D scanning device in your organisation was already in your pocket? For learning designers and instructional designers, capturing real-world...
Kyla Ball
4 min read
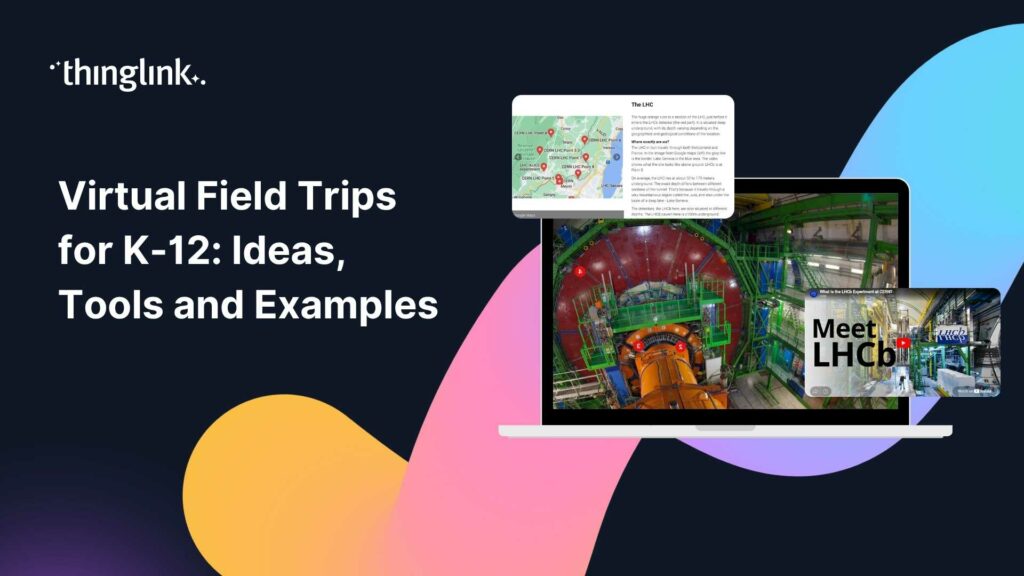
What if every student in your class could visit a mountain observatory, explore a religious site, or step inside a science museum, regardless of mobility, geography,...
Kyla Ball
5 min read
Your new hire starts on Monday. Their laptop is ready, their desk is booked, and someone has ordered the obligatory welcome pack. But here is the honest question:...
Kyla Ball
5 min read
Why Traditional Training Is No Longer Enough Your learners are switching off. Slide decks, compliance click-throughs, and passive video modules have been the backbone...
Kyla Ball
5 min read
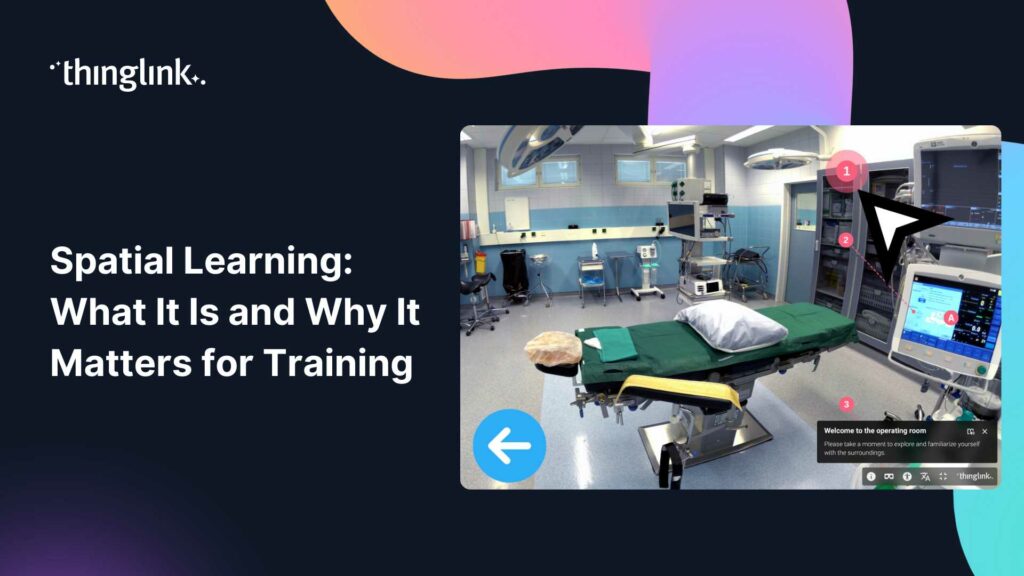
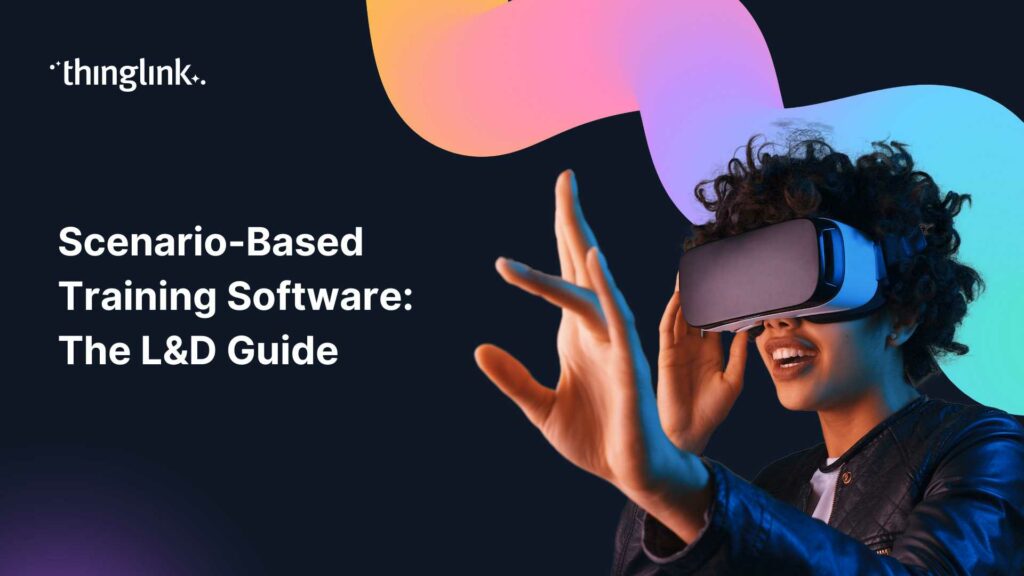
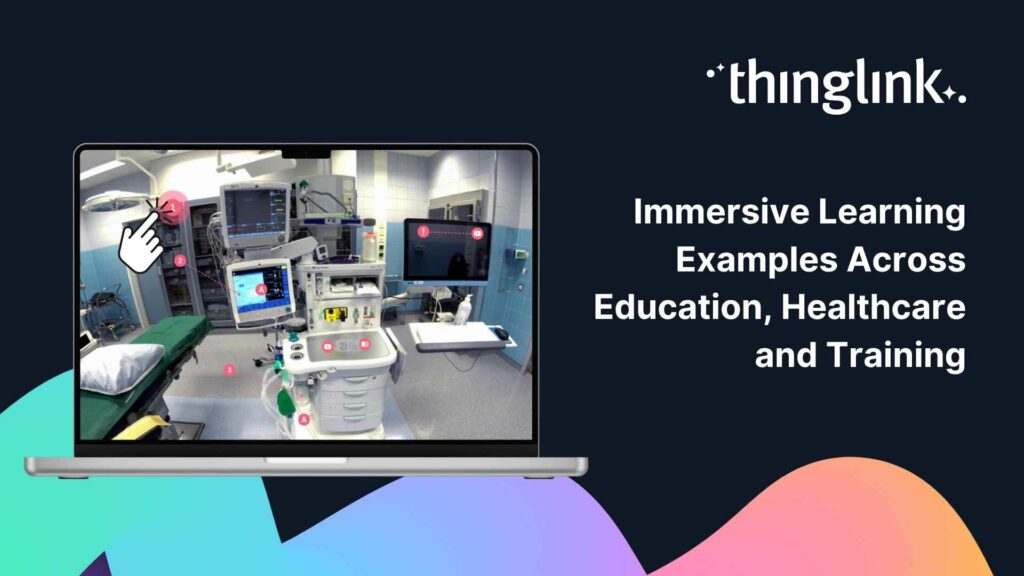
What Does Immersive Learning Actually Look Like in Practice? You have probably heard the term immersive learning used a lot lately. But when you work in healthcare...
Kyla Ball
4 min read
Your audience clicked play. Then they opened another tab, checked their phone, and missed the key message entirely. If that sounds familiar, you are not alone. ...
Kyla Ball
4 min read
Your learners are sitting through another click-through compliance module. They’re reading, clicking next, reading, clicking next. And by the time they close...
Kyla Ball
5 min read
What if your students were genuinely reluctant to stop learning? Not because you threatened a grade penalty, but because the lesson itself felt too good to quit?...
Kyla Ball
5 min read
Your visitors should never be limited by geography, mobility, or opening hours. Whether you run a heritage site, a contemporary art gallery, or a natural history...
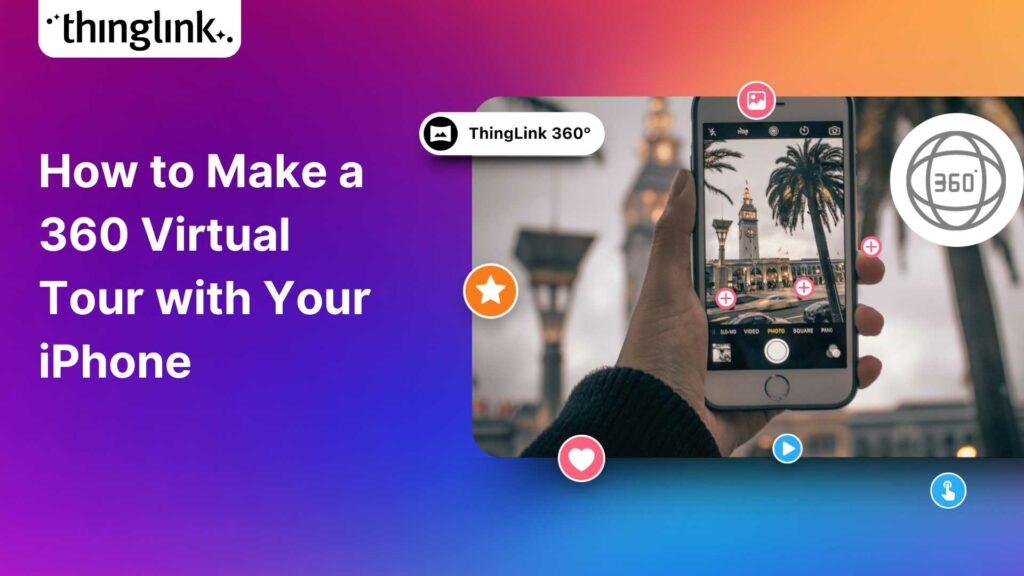
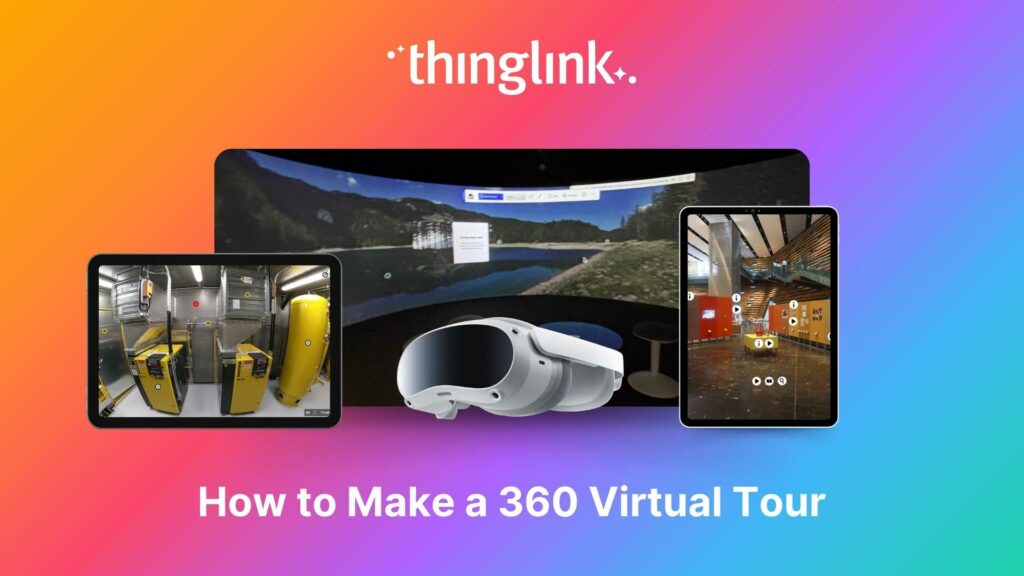
Turn Your iPhone Into a 360 Virtual Tour Creator What if the most powerful 360 virtual tour software you need is already in your pocket? With ThingLink’s ...
Kyla Ball
5 min read
Your learners are spread across three sites. Your budget does not stretch to a fleet of VR headsets. And your compliance deadline is in six weeks. Sound familiar?...
Kyla Ball
4 min read
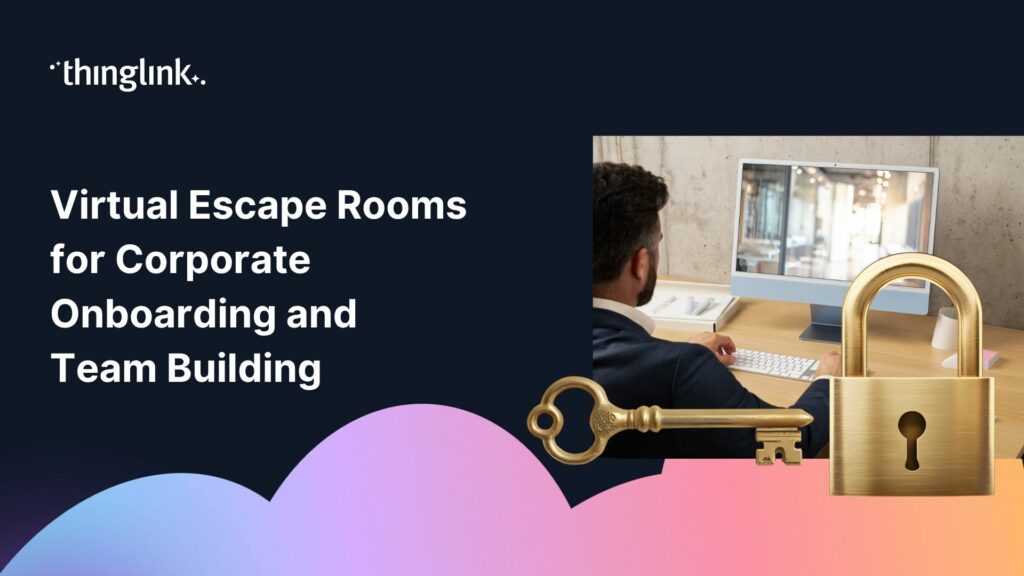
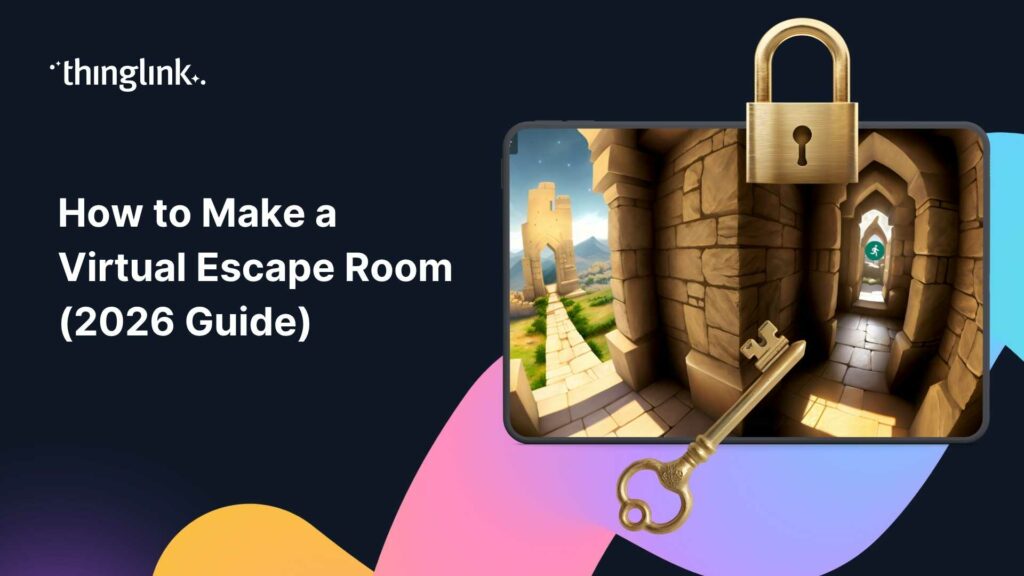
What if your new hire’s first week included solving a mystery, navigating a virtual office, and unlocking company knowledge one clue at a time? Virtual escape...
Kyla Ball
5 min read
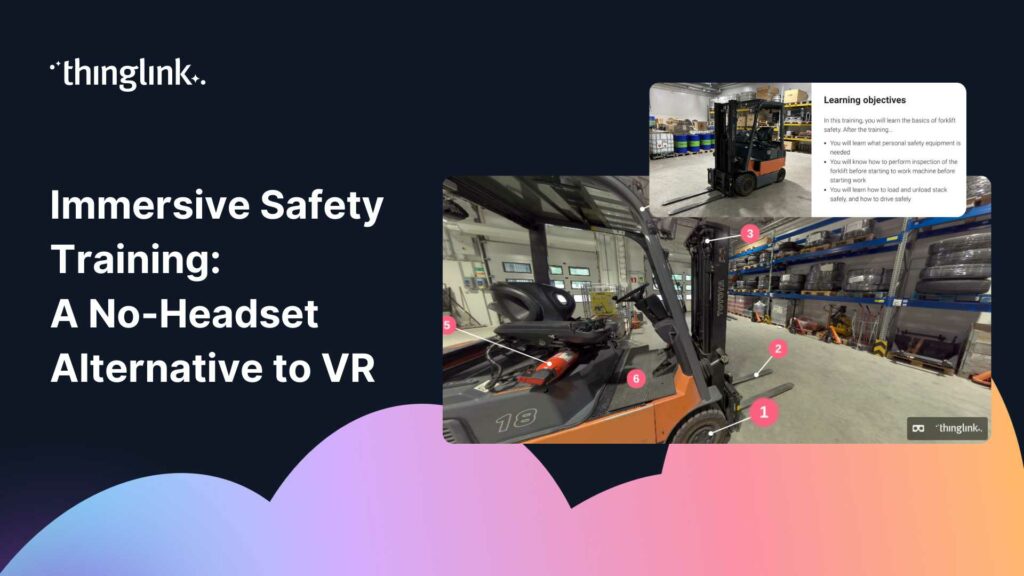
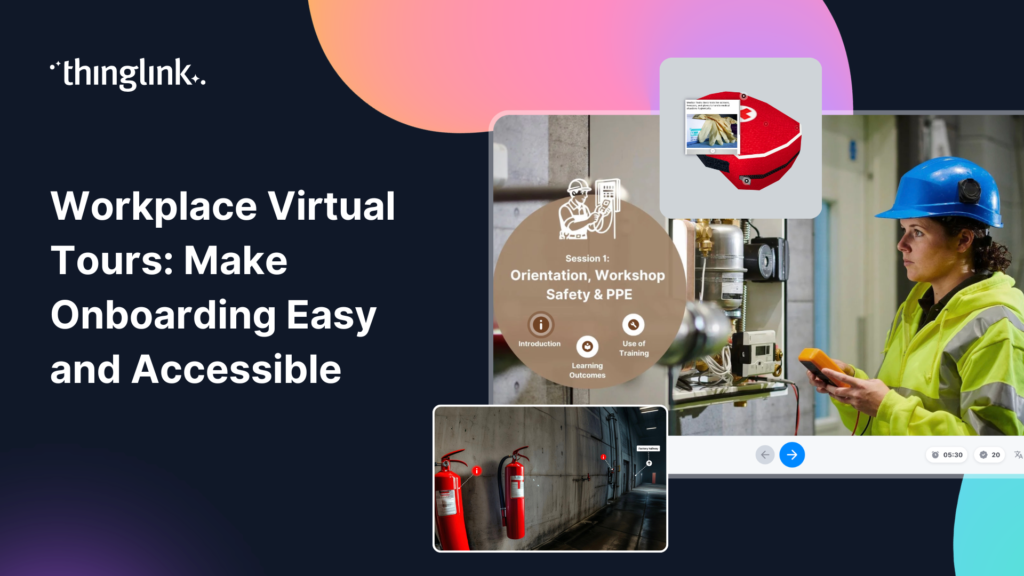
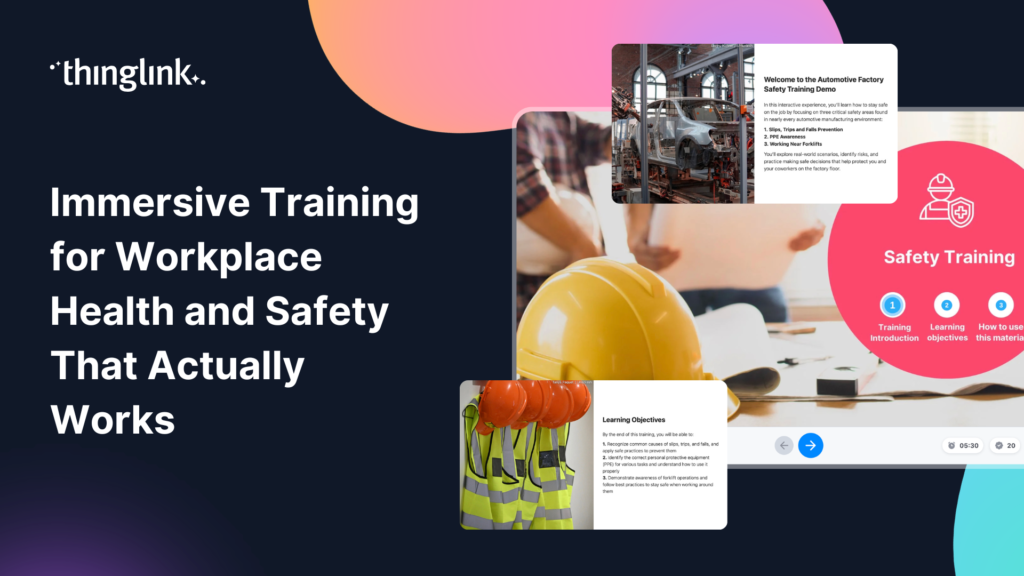
What if your new hires could walk the factory floor, identify hazards, and practise emergency procedures before they ever set foot on site? That is exactly what...
Digital Storytelling Techniques for the Modern Classroom Humans have always told stories. But the tools we use to tell them have changed dramatically, and so has...
Kyla Ball
7 min read
What if your students could stand inside a working observatory, walk the floors of a historic building, or explore a rainforest ecosystem — all before lunch? ...
Great learning experiences don’t rely on a single type of interaction. Sometimes learners need to recall key facts. Sometimes they need to recognize patterns,...
What if your students could stand inside a volcano, walk the halls of a world-class museum, or explore a university campus without leaving the classroom? Virtual...
Kyla Ball
7 min read
What if your next training module felt less like a slideshow and more like a mission? Virtual escape rooms are one of the most engaging formats in digital learning...
Kyla Ball
5 min read
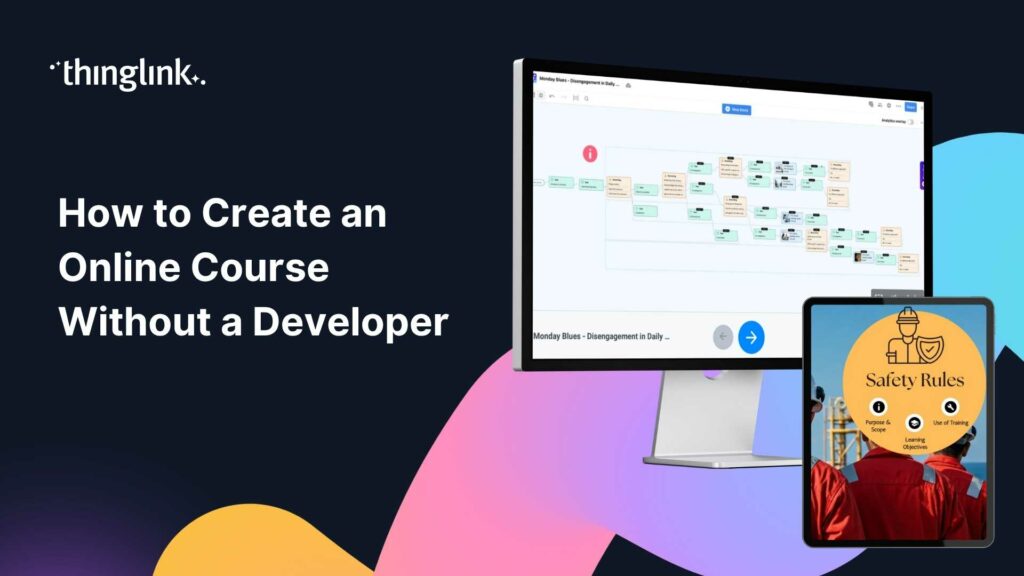
You have the expertise. You know what your team needs to learn. But every time you picture building an online course, you hit the same wall: you need a developer,...
Kyla Ball
7 min read
You have great training content. You also have a team of busy learners who click away from passive video within the first two minutes. Sound familiar? Interactive...
Kyla Ball
5 min read
What If Learning Felt More Like Playing? Imagine your students leaning forward in their seats, eager to find out what happens next. Imagine a lecture hall where...
Kyla Ball
7 min read
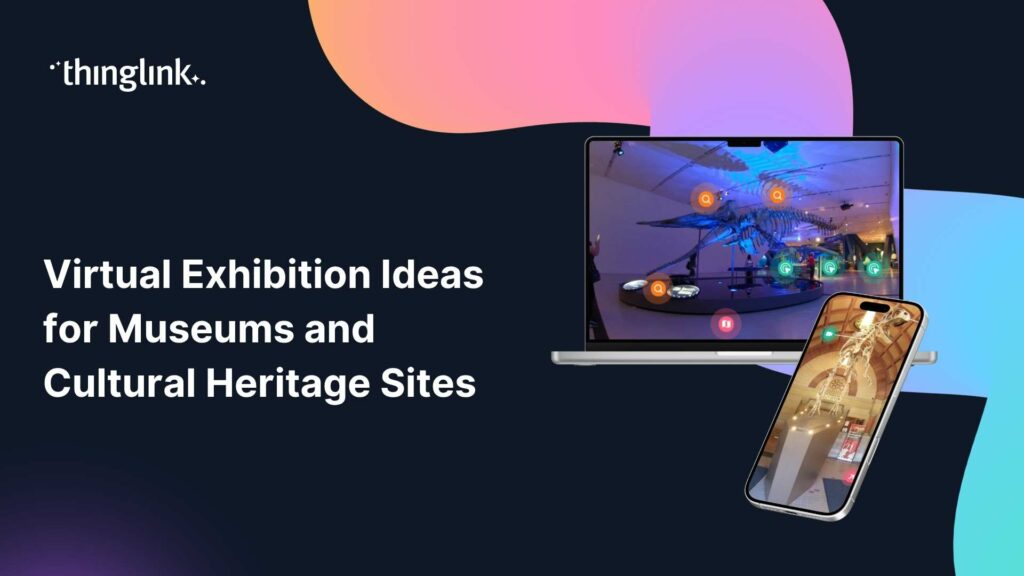
What Could Your Collection Look Like Online? Imagine a visitor exploring your gallery at midnight, zooming in on a centuries-old artifact, listening to a curator’s...
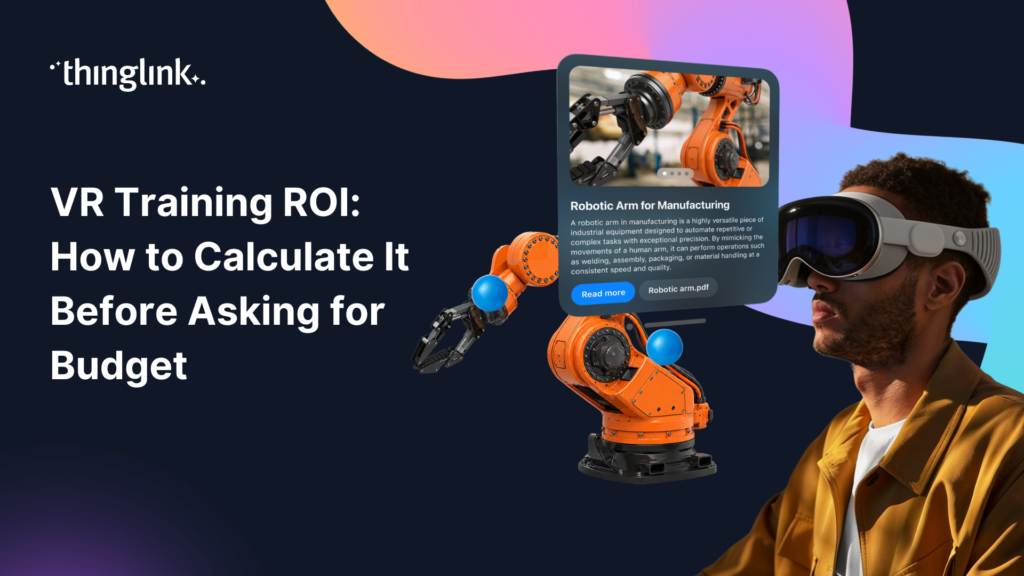
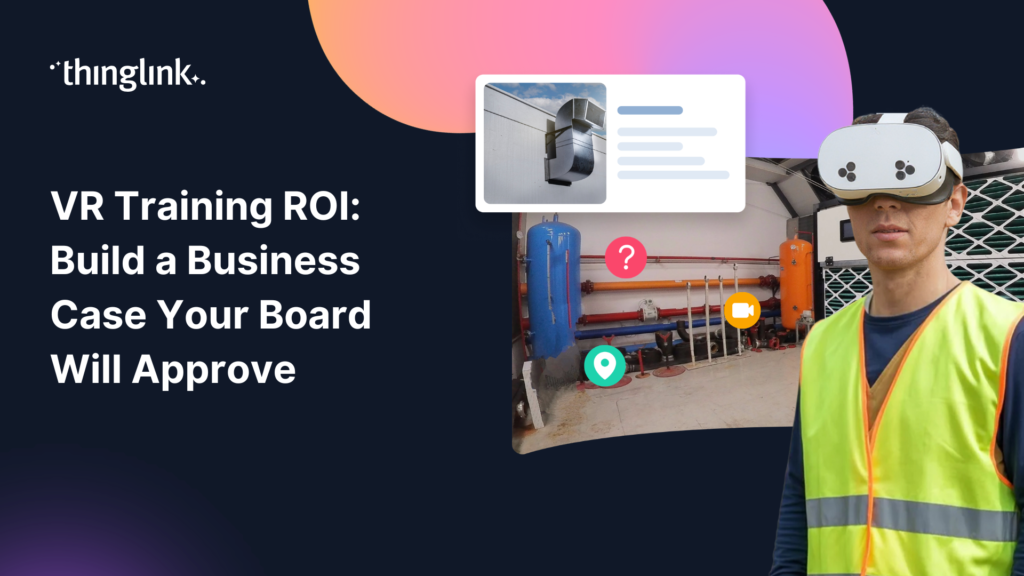
You already believe in immersive learning. Your challenge is convincing the person holding the budget. Before you walk into that meeting, you need more than enthusiasm....
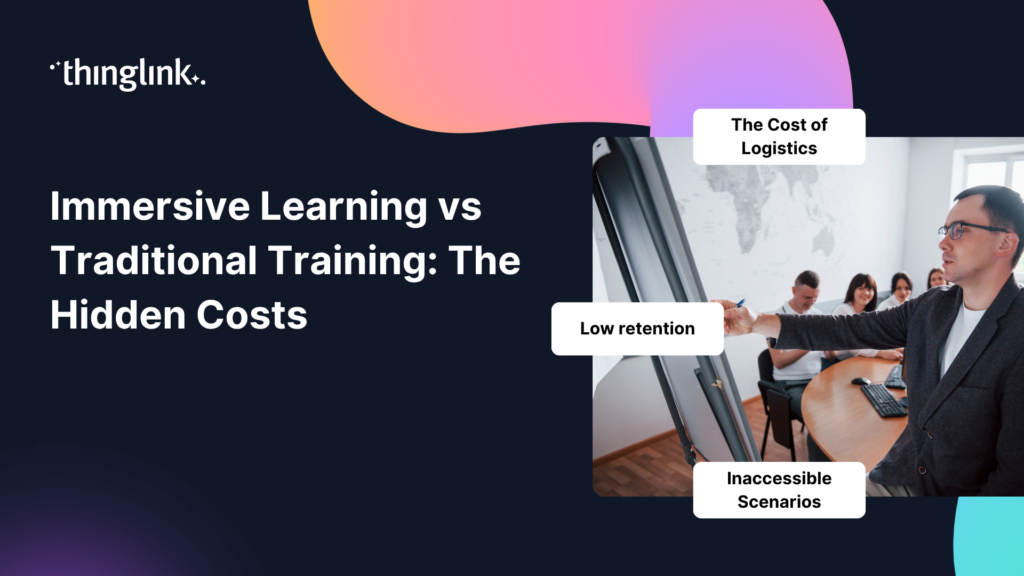
You've planned the session. Booked the room. Printed the handouts. Gathered the group. And two weeks later, most of what was covered has quietly vanished from...
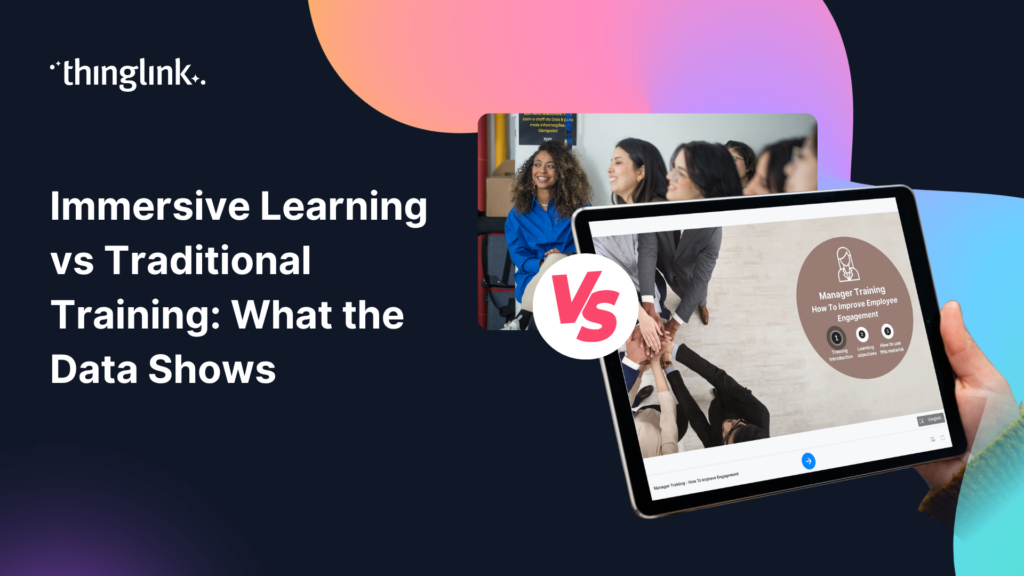
Immersive Learning vs Traditional Training: What the Data Actually Shows You've sat through the slide decks. You've administered the compliance click-throughs....
You've sat through the end-of-year review. Completion rates are acceptable. Quiz scores look fine on paper. But six months later, your employees can't recall...
You already know immersive learning works. You've seen the engagement numbers, heard the feedback from pilot participants, and watched colleagues at other organisations...
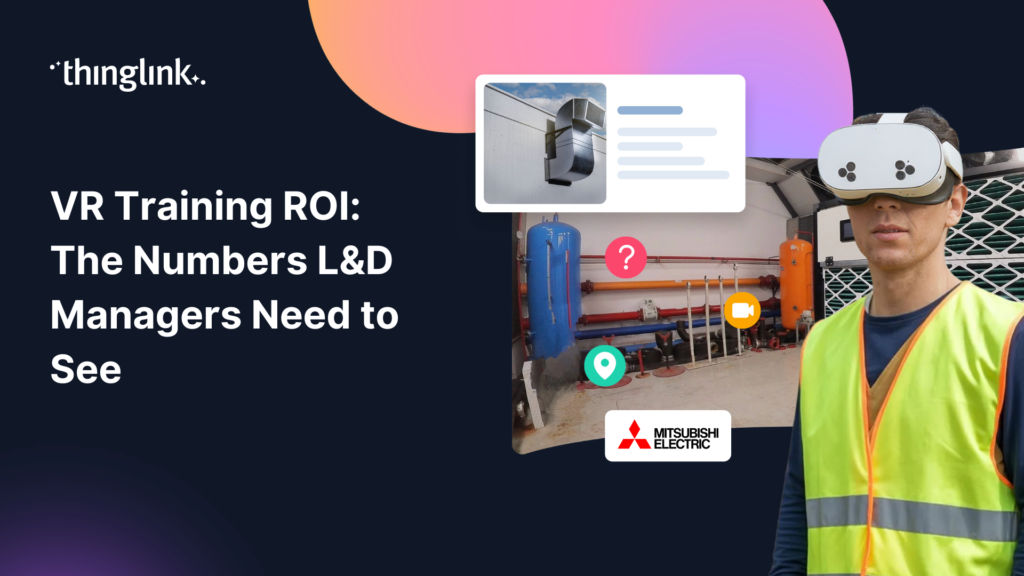
You're under pressure to prove that every training pound or dollar is well spent. So when someone suggests replacing classroom sessions or e-learning modules...
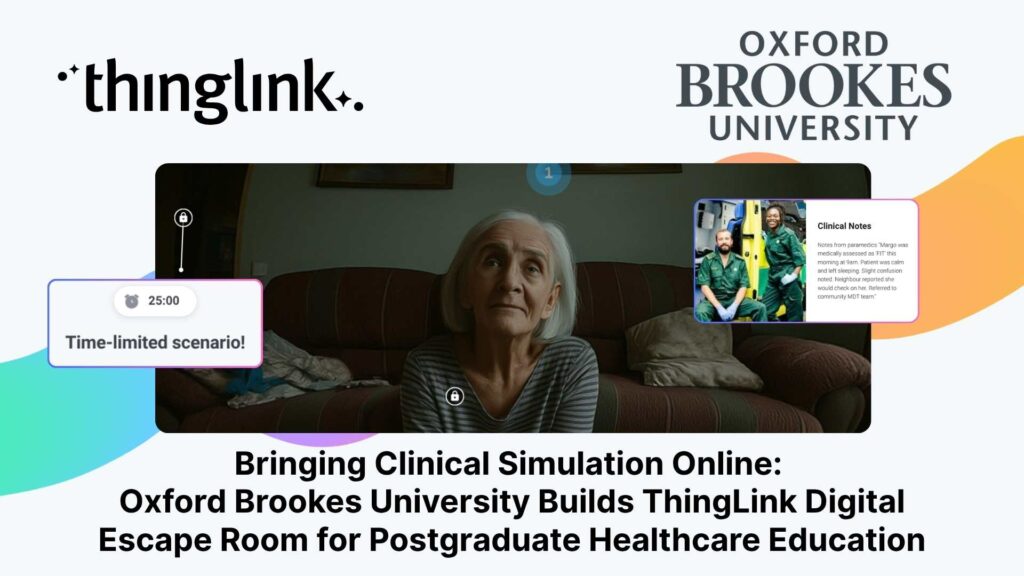
Institution: Oxford Brookes University, Faculty of Health Science and Technology Lead: Emma Mellors, Senior Lecturer Advanced and Specialist Practice / CPD Programmes...
Kyla Ball
4 min read
When English teacher Bayly DiPilato set out to reimagine her end-of-year assessment, she had a clear goal: replace the traditional research paper with something...
Kyla Ball
4 min read
What if your new hire could walk the floor, meet their team, and understand the layout of their workplace before they even arrive? For many organisations, the first...
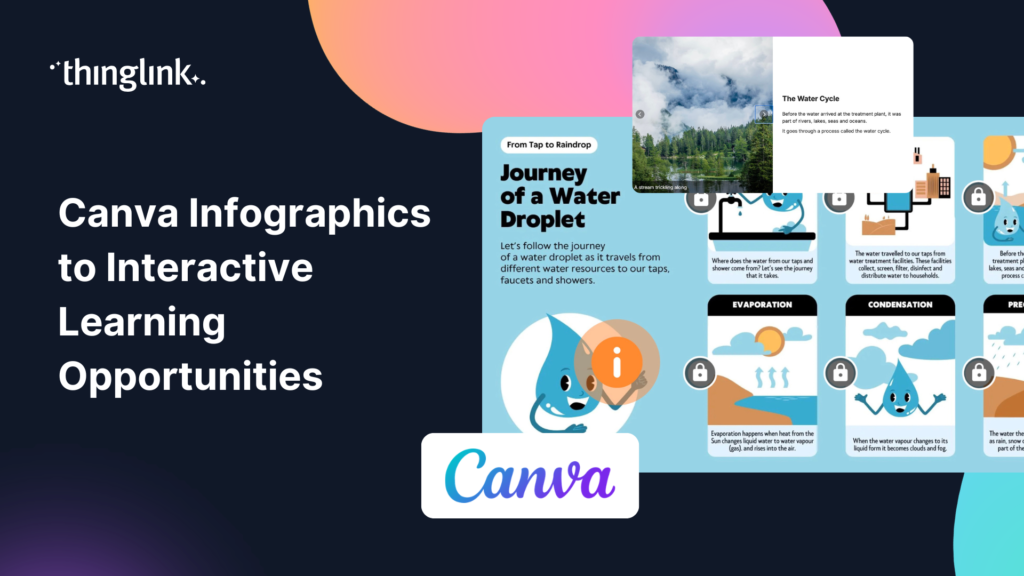
You’ve spent time building a beautiful infographic in Canva. Your students glance at it, maybe read a few bullet points, and move on. Sound familiar? Static...
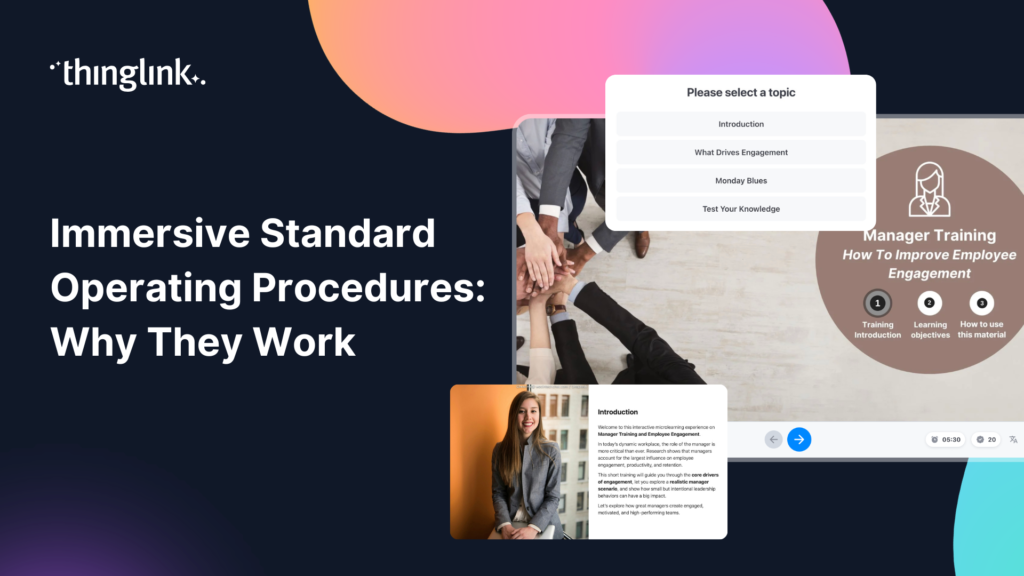
Your standard operating procedures are only as good as the training behind them. If your team is skimming PDFs, clicking through generic slide decks, or sitting...
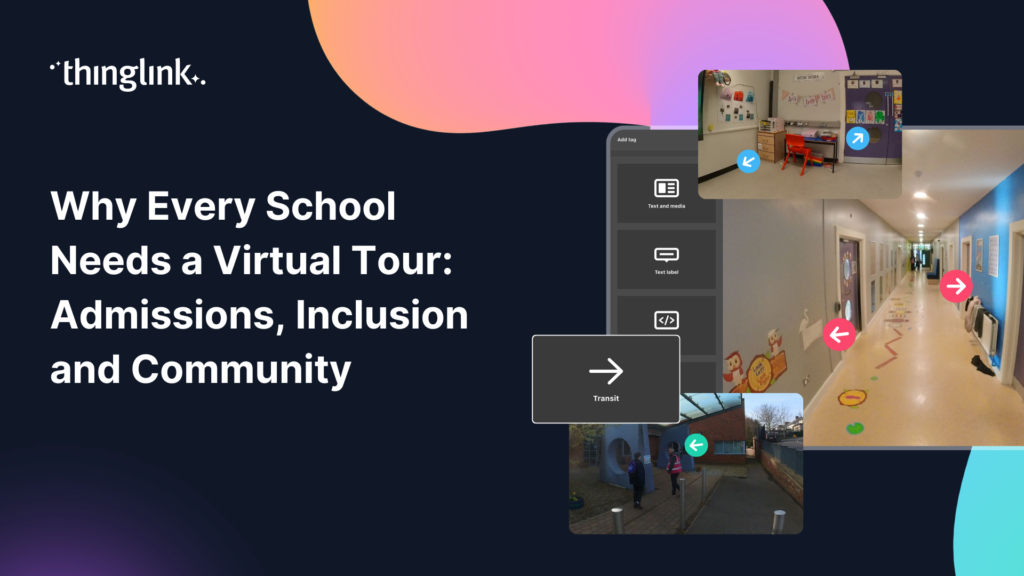
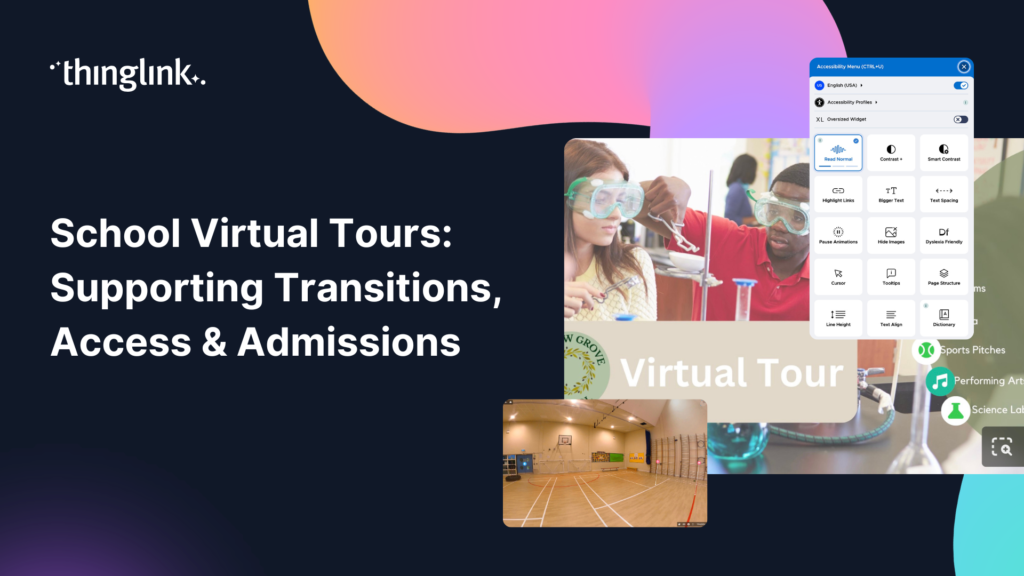
What if every prospective family could walk your school’s corridors before they ever set foot through the door? What if a student with anxiety about starting...
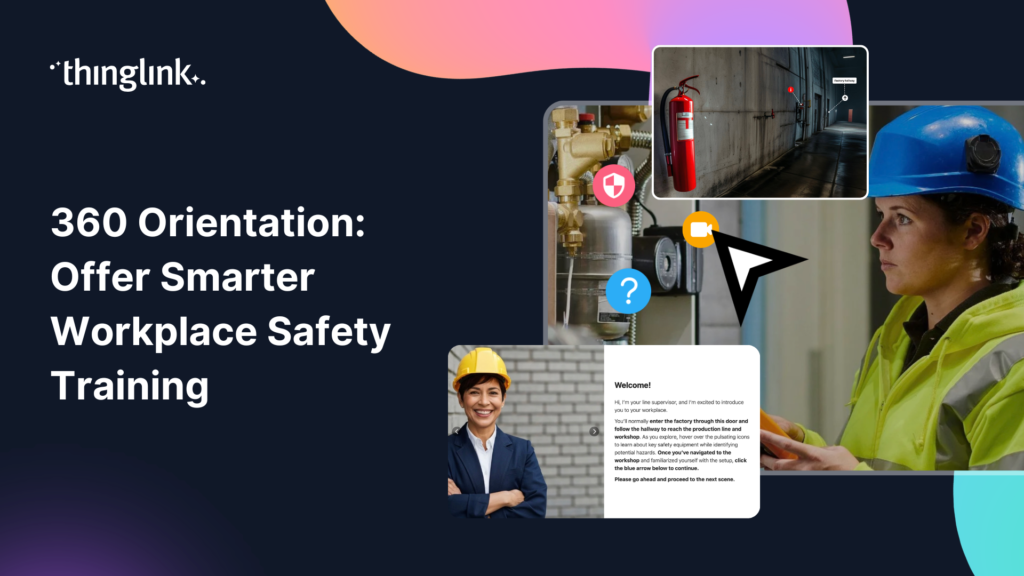
What if your team could practise responding to a chemical spill, a fire evacuation, or a machinery fault — before anything went wrong in real life? That is the...
Starting a new school is one of the biggest changes a child faces. For many students, especially those with additional needs, the anxiety of walking into an unfamiliar...
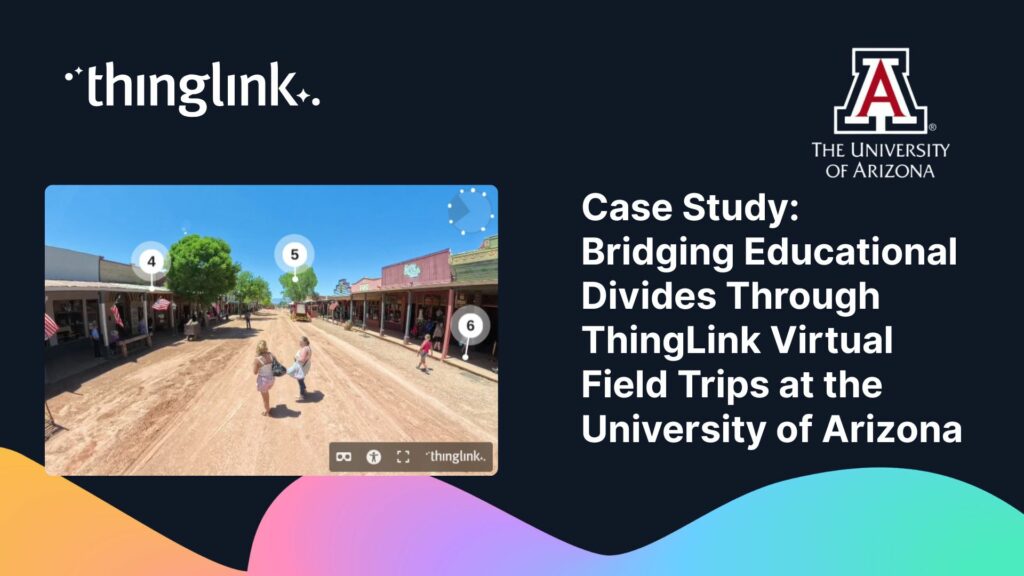
Christopher Sanderson, PhD, is a Senior Lecturer in the Department of Teaching, Learning, and Sociocultural Studies in the College of Education at the University...
Kyla Ball
5 min read
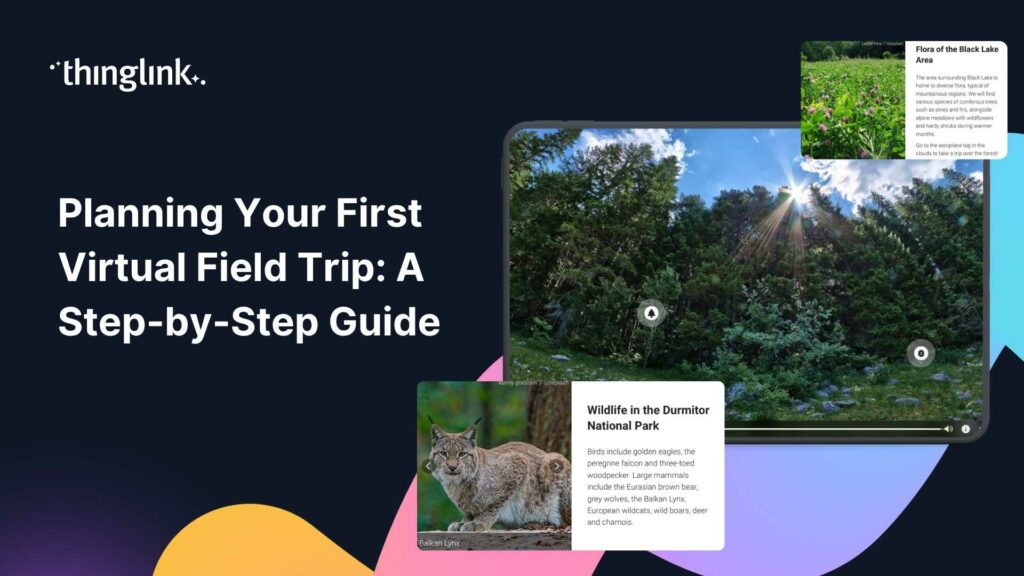
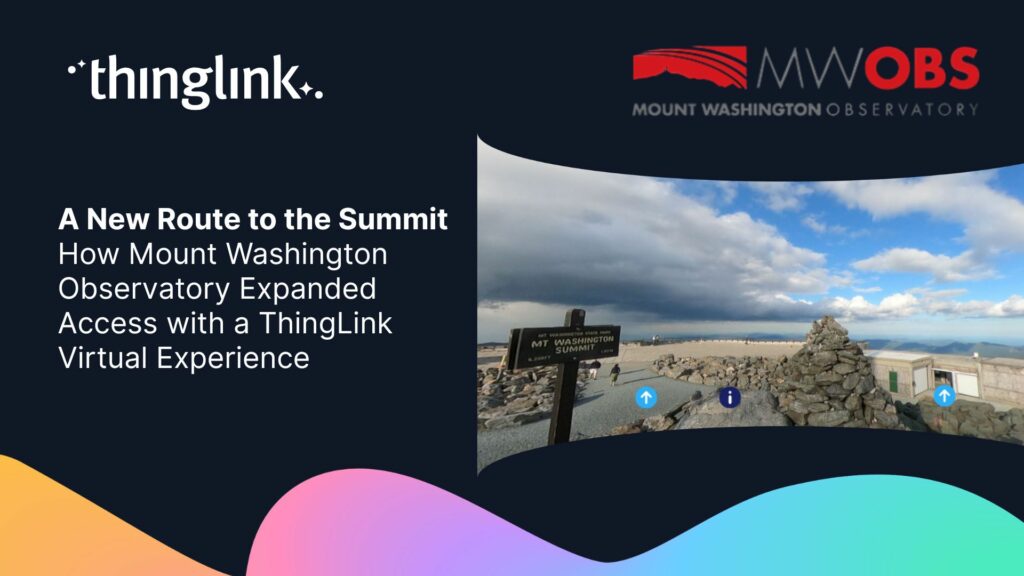
The Background and the Challenge Mount Washington Observatory (MWOBS) sits atop the highest peak in the northeastern United States — home to some of the world’s...
Kyla Ball
3 min read
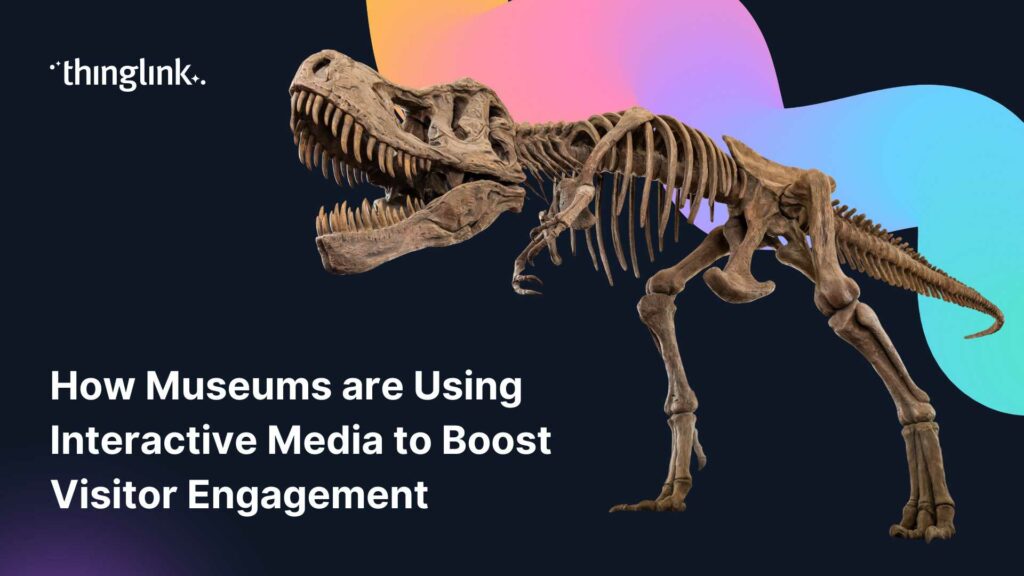
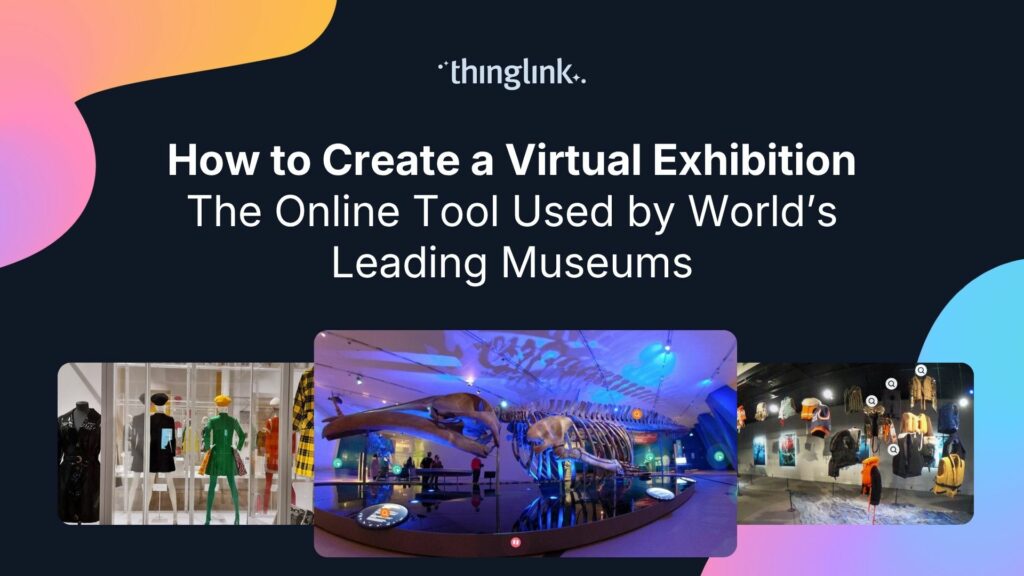
Regardless of size, museums worldwide face challenges related to funding, staffing, and audience engagement. One way that museums are overcoming these challenges...
Kyla Ball
7 min read
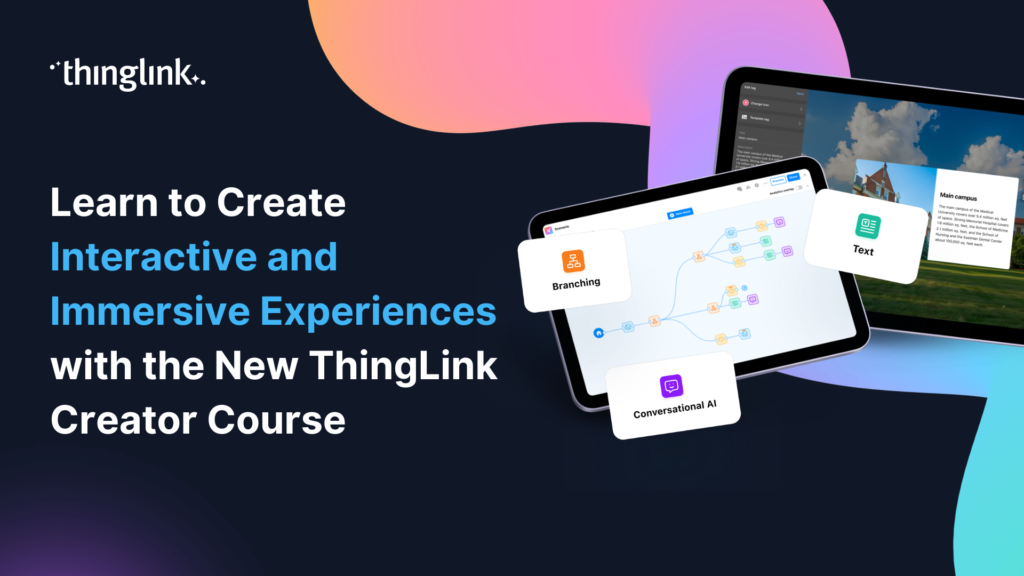
🚀 The Official ThingLink Certified Creator Course is now live! Whether you’re completely new to ThingLink or looking to deepen your skills, the new Certified...
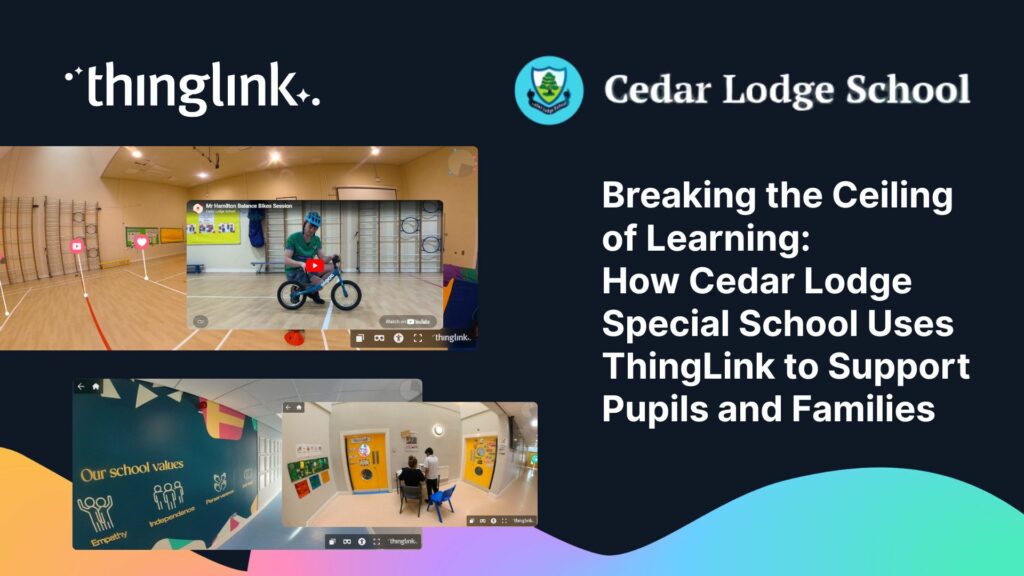
At Cedar Lodge School, Principal Chris Murphy and his team are using ThingLink and other digital tools to create learning experiences that “break the ceiling ...
Kyla Ball
5 min read
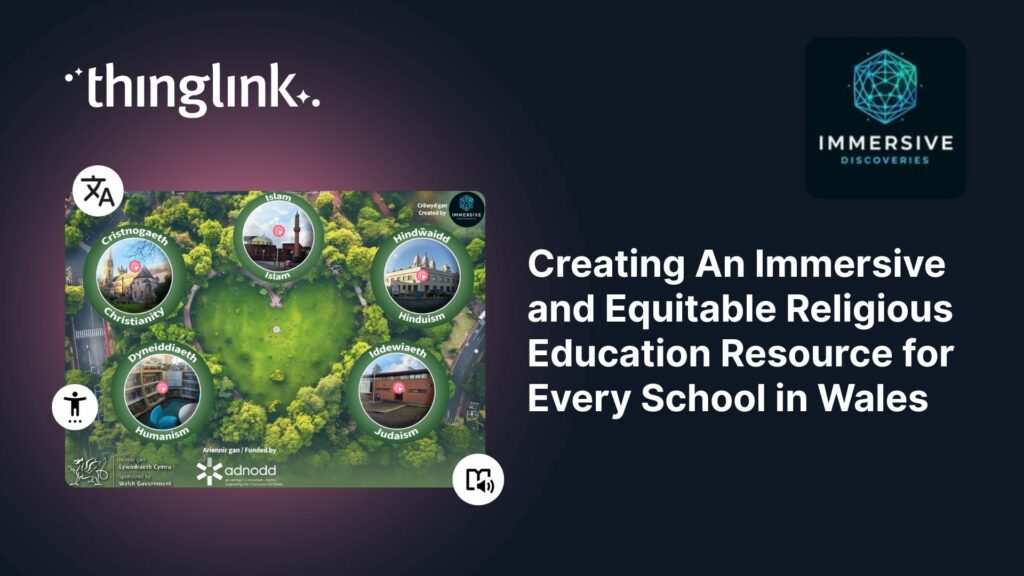
Educator Gemma Zeeman is founder of Immersive Discoveries, and a Qualified Teacher who has taught from Reception to Year 6. She currently works as a Research Assistant...
Kyla Ball
8 min read
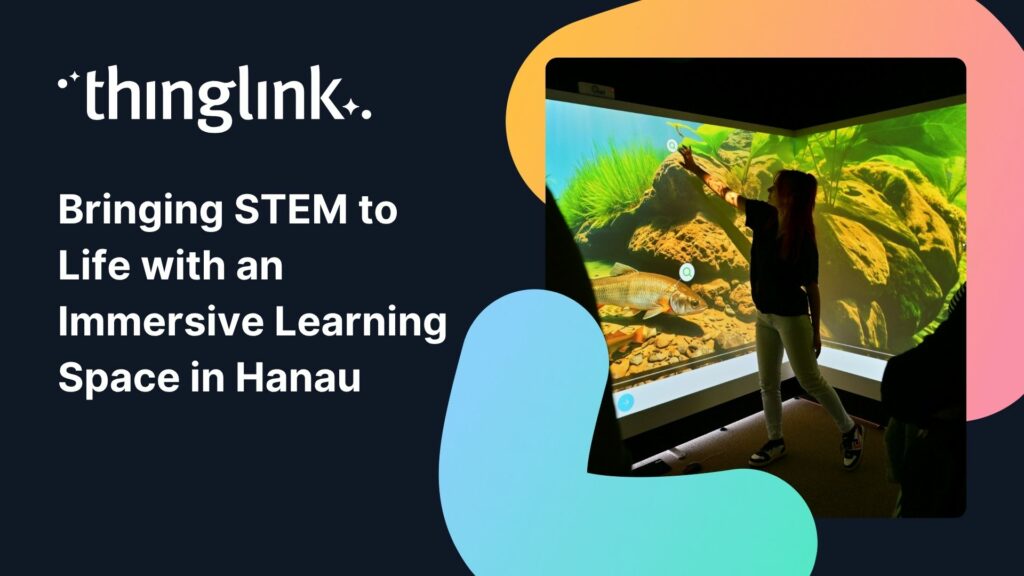
How Kathinka-Platzhoff-Stiftung used ThingLink to build an innovative STEM-focused immersive learning environment – and open it to the whole community. Location:...
Kyla Ball
4 min read
Haaste ISS Palveluiden CMS-yksikkö vastaa siivouksesta, kiinteistöhuollosta ja teknisistä palveluista Joensuun alueella. Business Joensuu hallinnoi Joensuun ...
Kyla Ball
3 min read
Challenge The CMS unit of ISS Palvelut is responsible for cleaning, property maintenance and technical services in the Joensuu region. Business Joensuu manages ...
Kyla Ball
4 min read
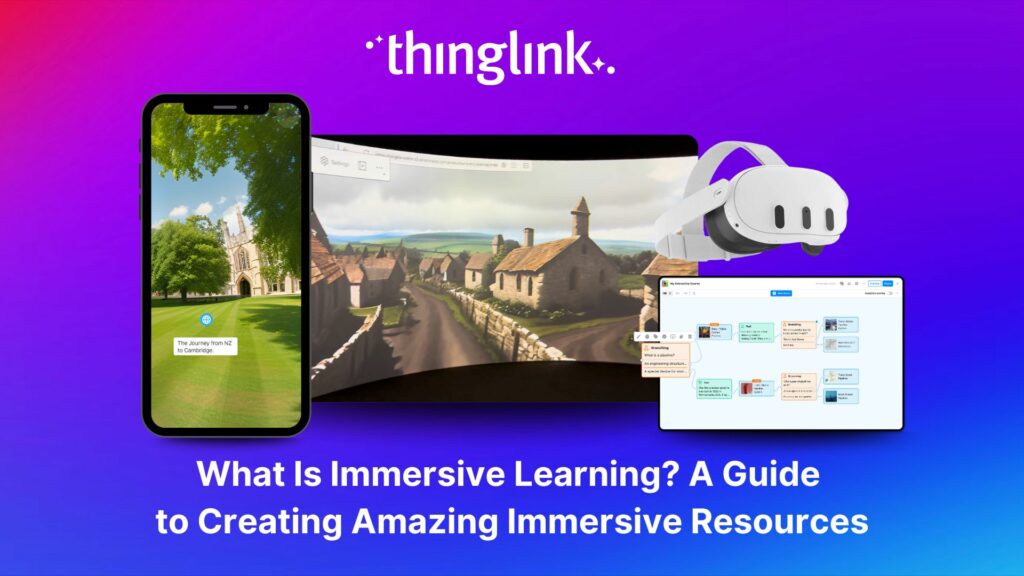
What is Immersive Learning? Immersive learning is a modern approach to education and training that uses interactive, spatial experiences to place learners in real-world...
Kyla Ball
6 min read
East Renfrewshire Council’s Education Department sought to improve how they delivered training, shared resources, and communicated with teachers across a diverse...
Kyla Ball
5 min read
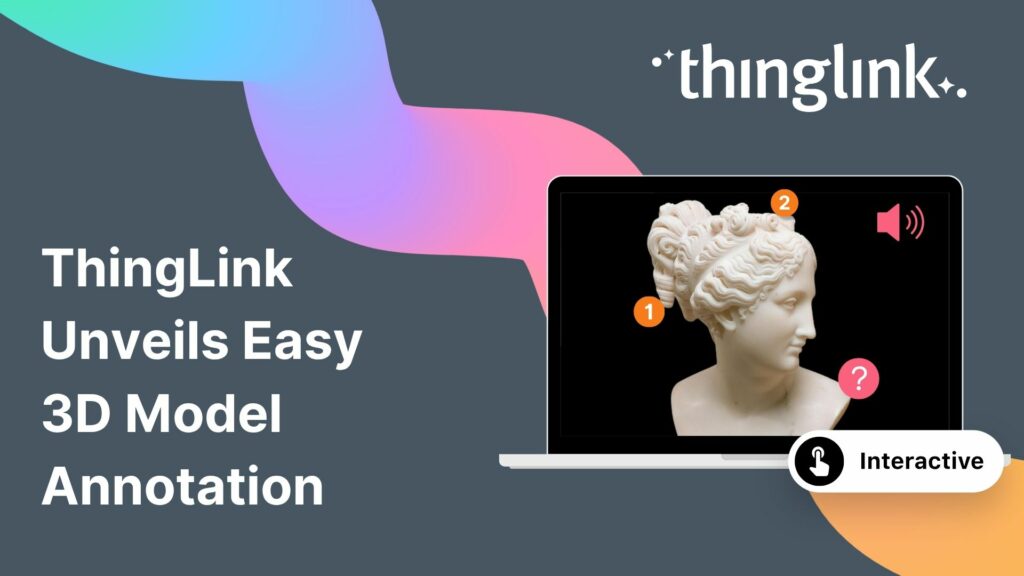
The interactive media platform ThingLink now supports 3D model annotation. In addition to images and videos, ThingLink content creators can now also enhance 3D ...
Kyla Ball
2 min read
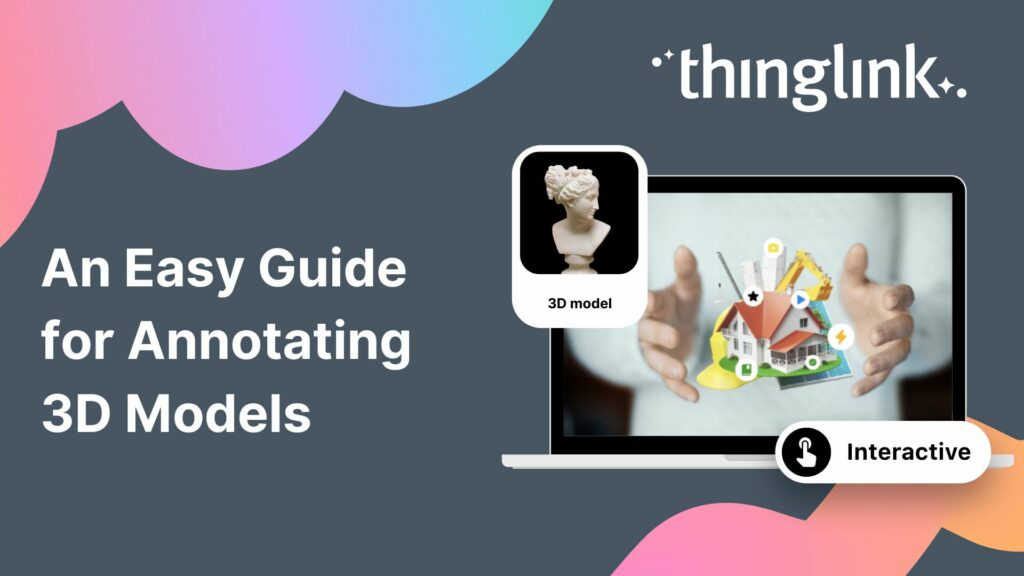
3D models are gaining popularity as the process of creating them has become more user-friendly. A few years ago you needed dedicated 3D modelling software, and ...
What is 3D Model Annotation? ThingLink allows users to create interactive 3D models as easily as they create interactive images, videos and virtual tours. The feature...
Kyla Ball
3 min read
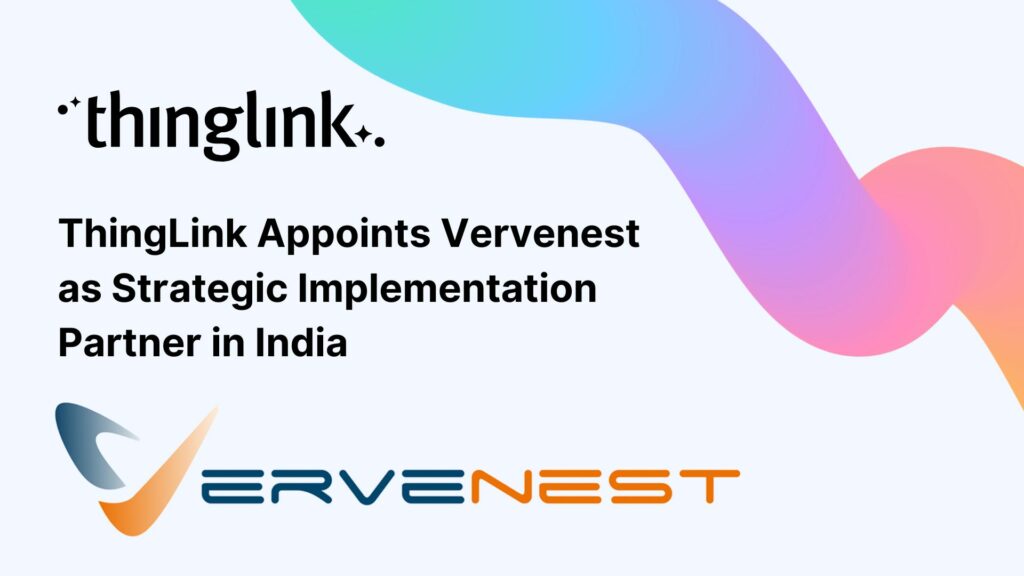
Helsinki, 12 March 2026 ThingLink has entered into a strategic partnership with Vervenest Technologies Private Limited to support the expansion of immersive learning...
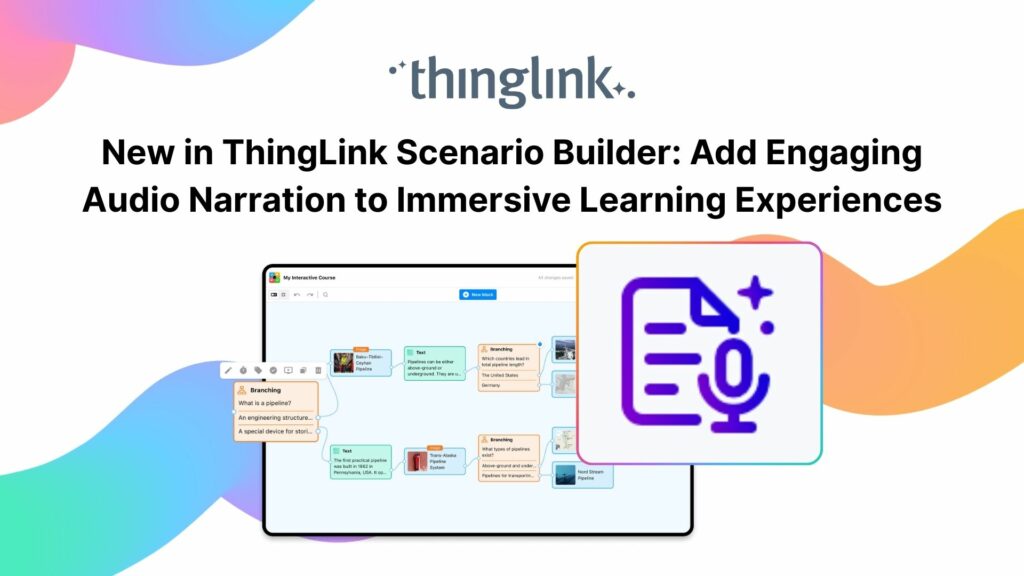
Your text becomes a part of your learning experience, create immersive, podcast-worthy audio every time. We’re excited to introduce a new audio narration feature...
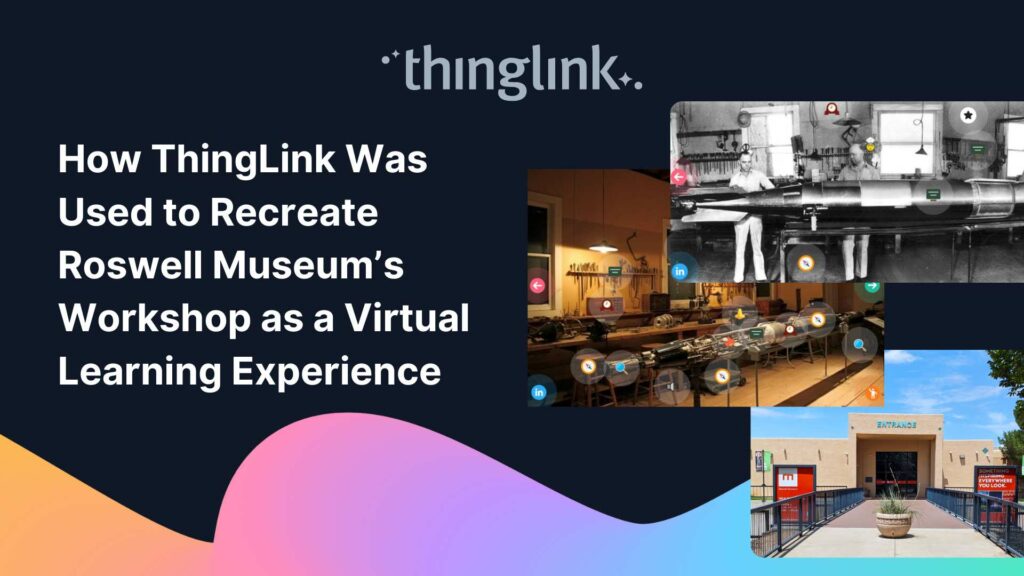
Background: A Museum Lost to Flooding When catastrophic flooding occurred at the Roswell Museum in New Mexico in October 2024, the loss went far beyond physical...
Kyla Ball
6 min read
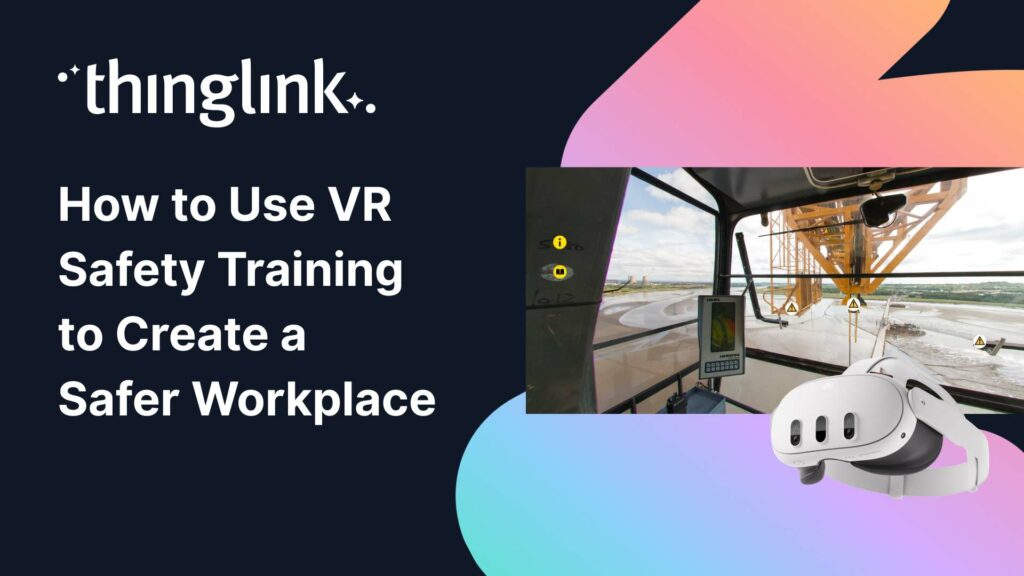
Protecting employee health and safety is one of the most fundamental responsibilities of any organization. Especially in high-risk industries, even a single incident...
Kyla Ball
6 min read
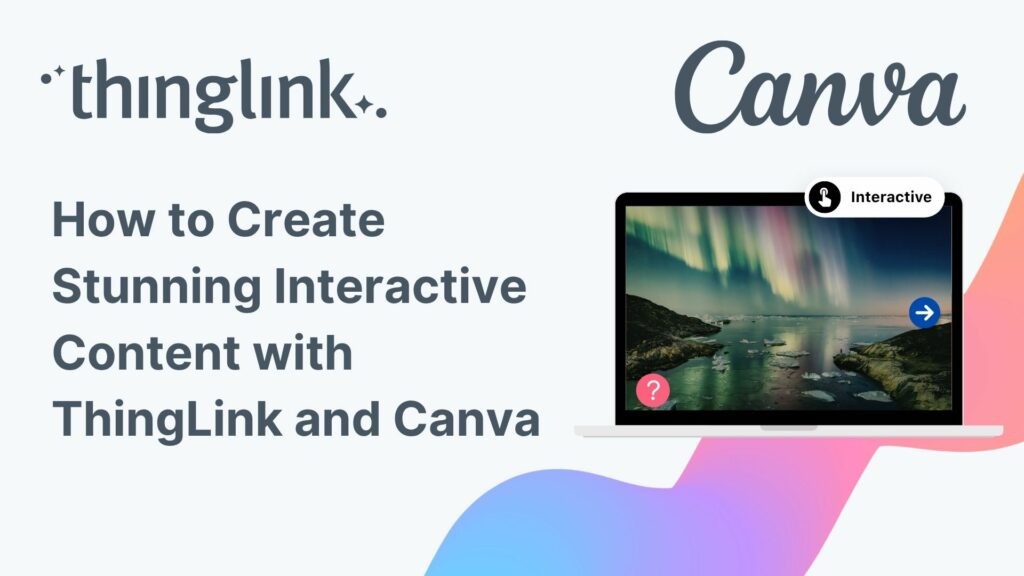
ThingLink’s powerful integration with Canva, the global visual communications platform, is now slicker than ever. You can now create and edit your base images...
Kyla Ball
5 min read
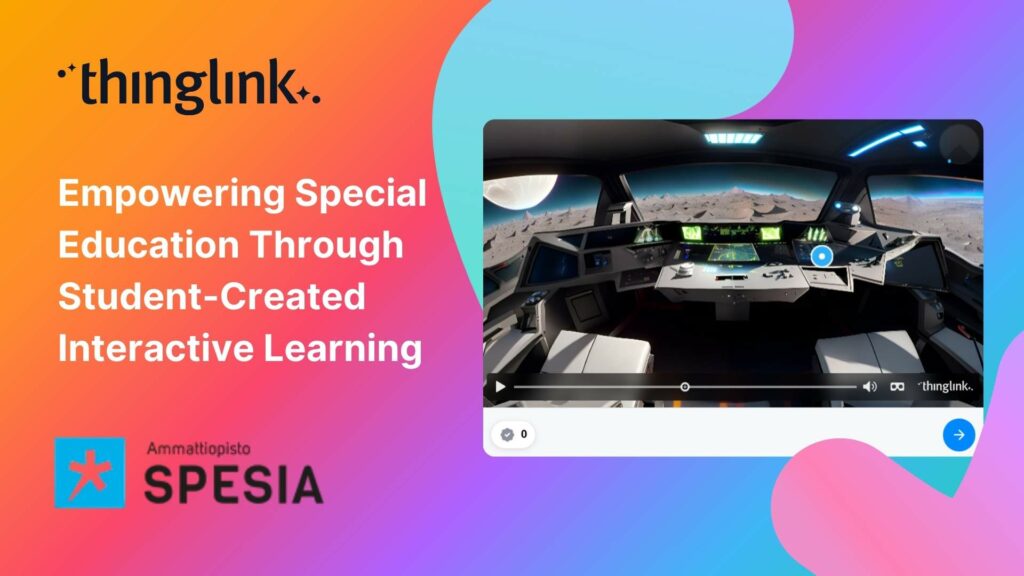
For students at Spesia vocational and special education college, ThingLink isn’t just a learning platform, but a tool for designing and building their own interactive...
Kyla Ball
5 min read
Background Tankespirerne (translated as “Thought Sprouts”) is a Danish educational consultancy led by Martin Kongshave, elementary school teacher and practitioner...
Kyla Ball
5 min read
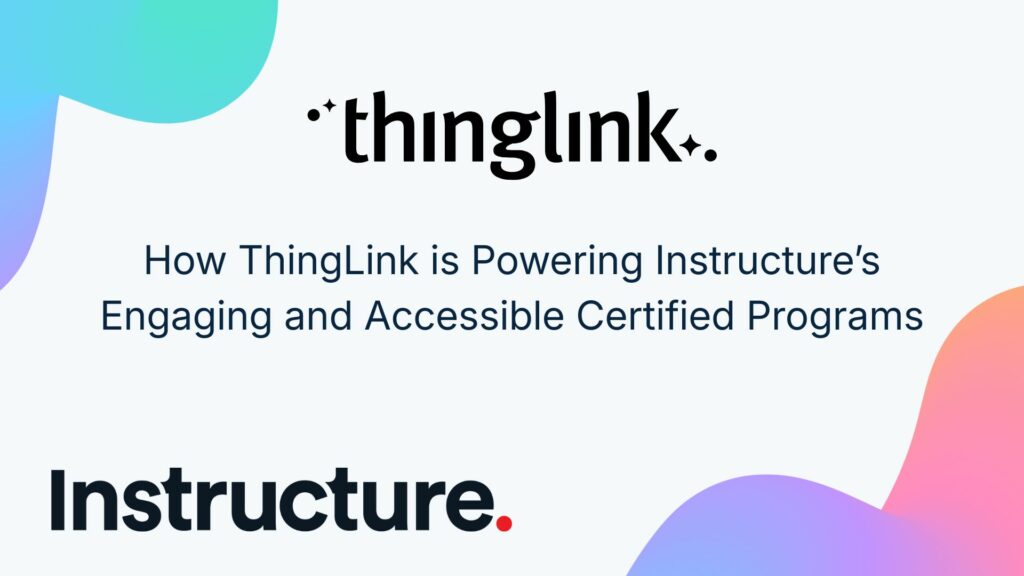
Instructure is the global EdTech organization used by over 19 million unique users annually. It’s probably best-known as the home of Canvas, their flagship product...
Kyla Ball
5 min read
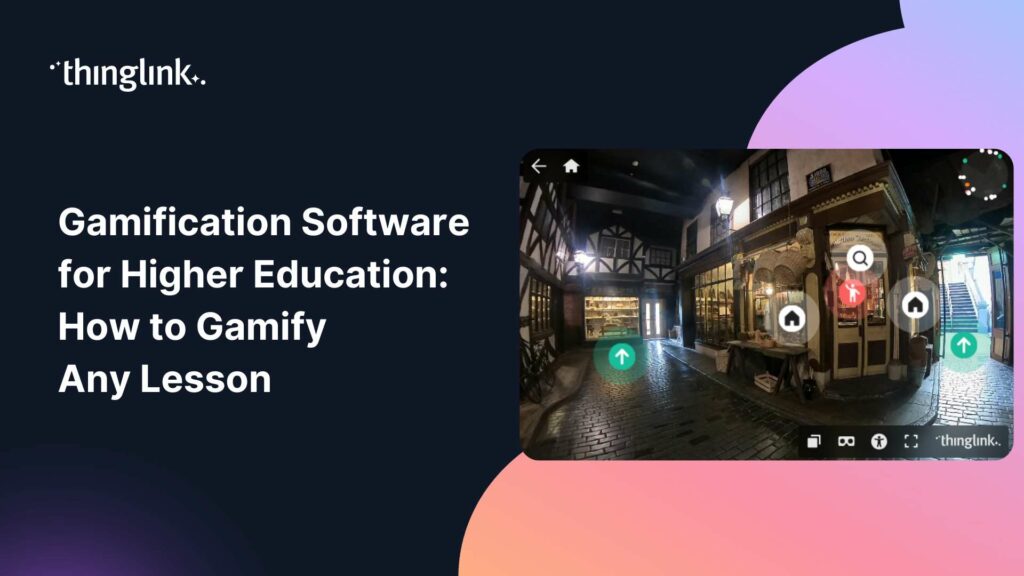
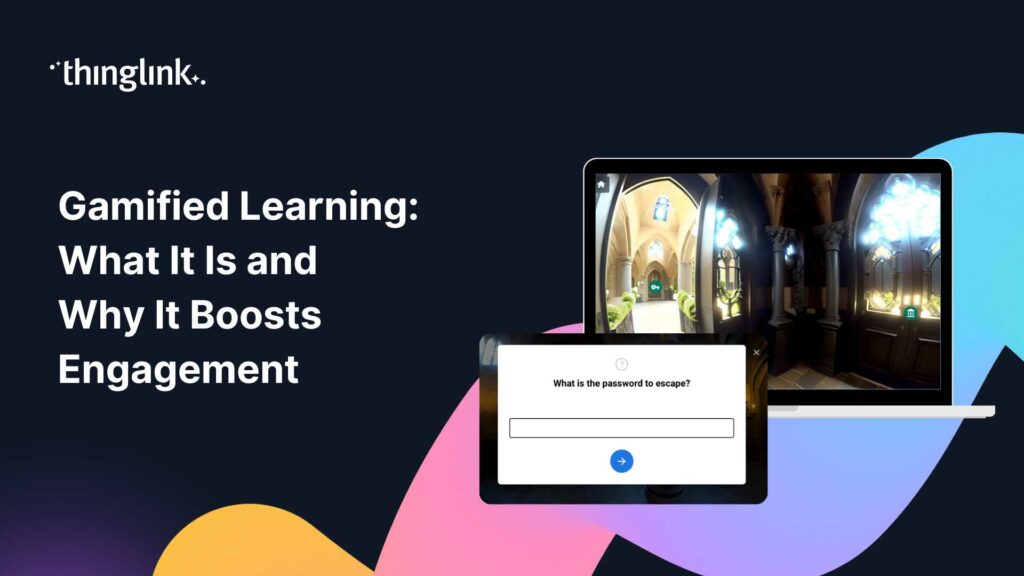
Transforming Education with Gamified Learning Experiences Education stands on the edge of a significant transformation, driven by innovative technologies that redefine...
Kyla Ball
5 min read
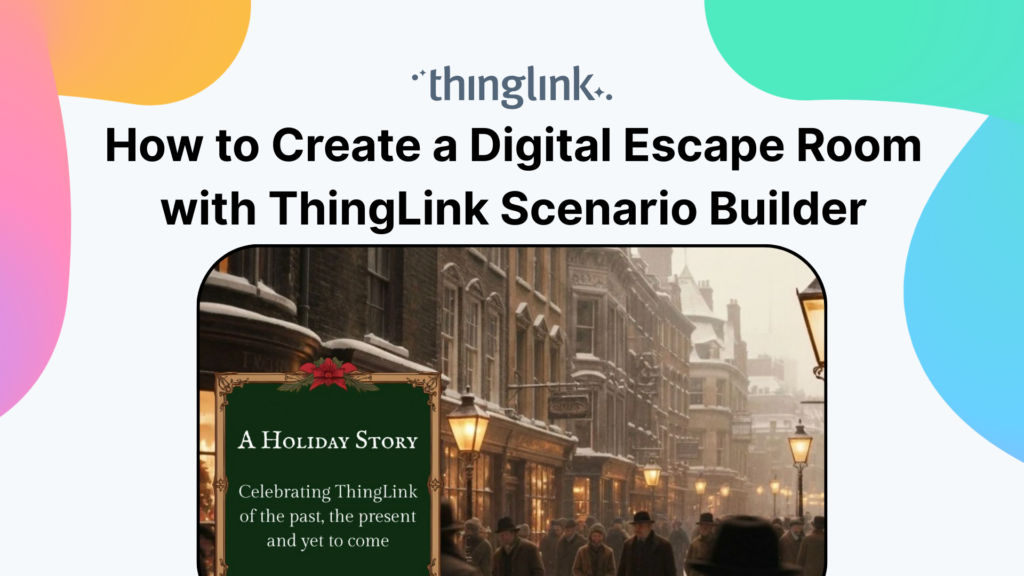
Are you ready to captivate your audience with an immersive, interactive experience? Digital escape rooms offer a unique way to engage, educate, and entertain your...
This teacher training resource for students on the PGCE course (Post Graduate Certificate in Education) demonstrates how ThingLink can be used to create interactive...
Kyla Ball
4 min read
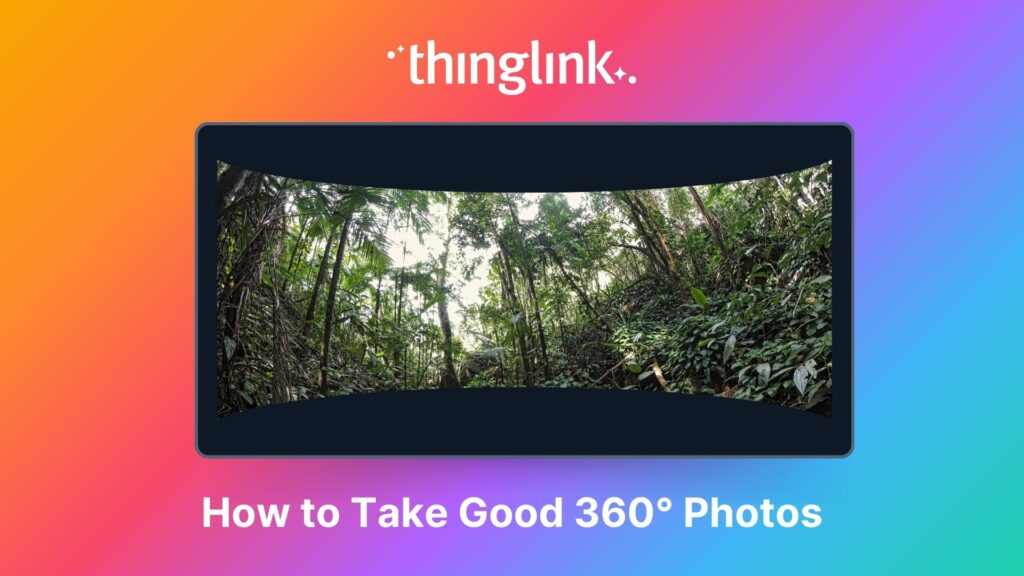
An Introduction to 360° Photography for Beginners 360 degree images or photospheres capture the entire surrounding environment in a single shot, allowing viewers...
For many higher and further education institutions, the integration of new technologies like AV equipment often presents a double-edged sword. While advancements...
Kyla Ball
6 min read
Plans for Every Educator and Every Institution We’ve listened to educators about what they need from their ThingLink plans for their students, school districts,...
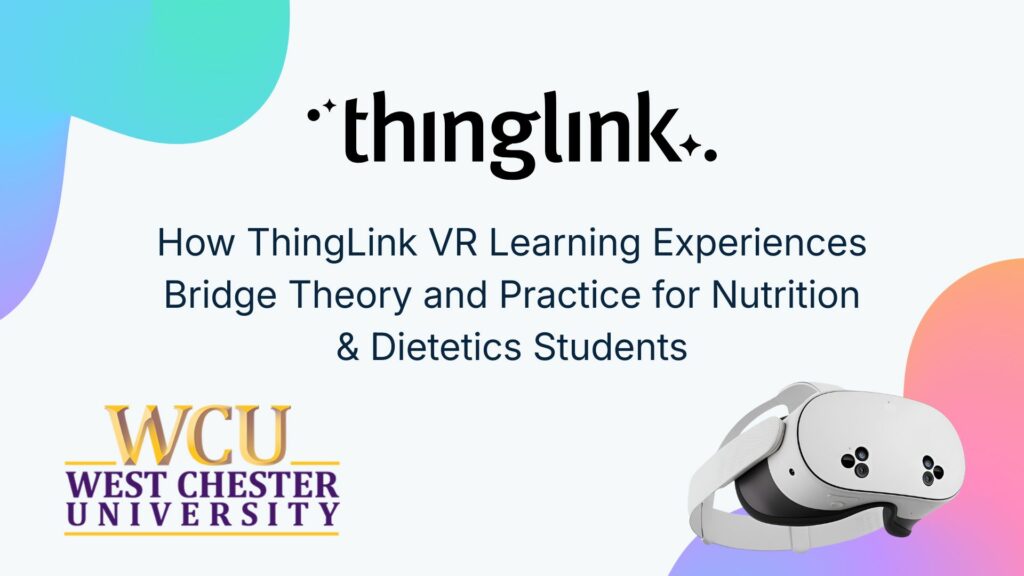
Nutrition and dietetics higher education programs face a critical challenge common across healthcare studies: effectively connecting theoretical knowledge with ...
Kyla Ball
9 min read
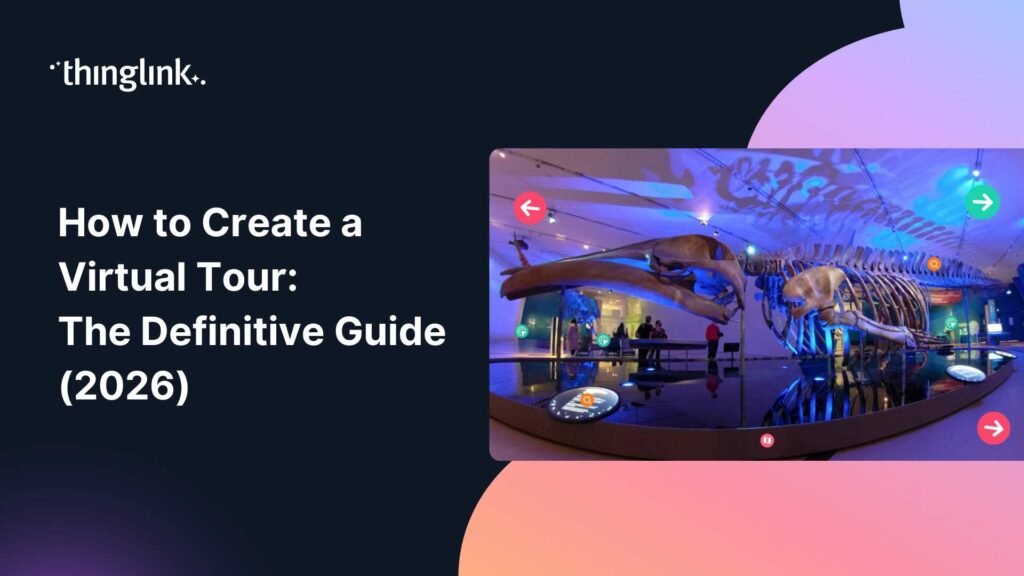
Looking for an easy way to create immersive 360° virtual tours or virtual expeditions that work seamlessly in Virtual Reality (VR)? ThingLink is the ultimate all-in-one...
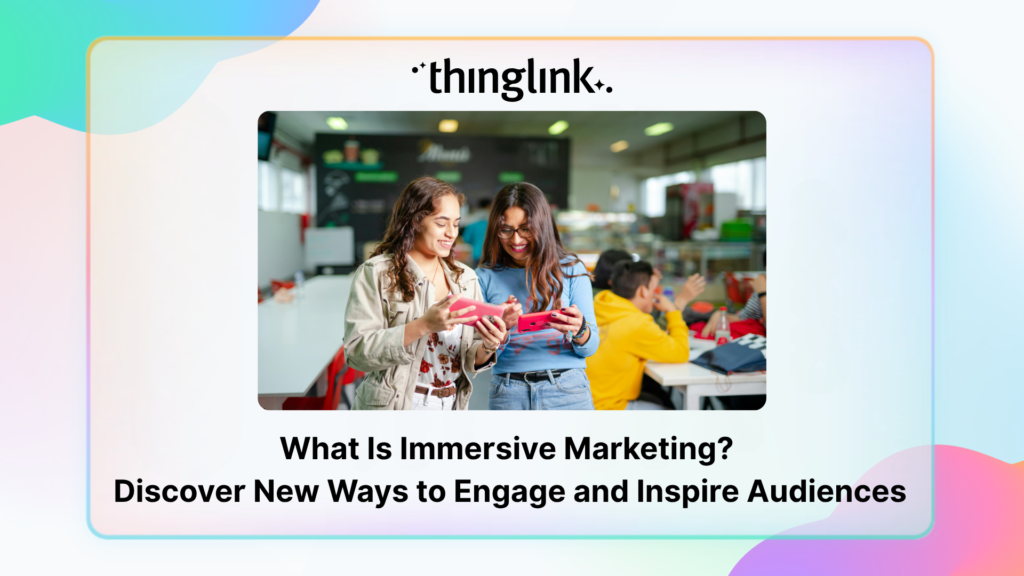
How can marketers truly attract and engage consumers in the saturated world of digital marketing? Attention is hard to earn and easy to lose. Audiences want something...
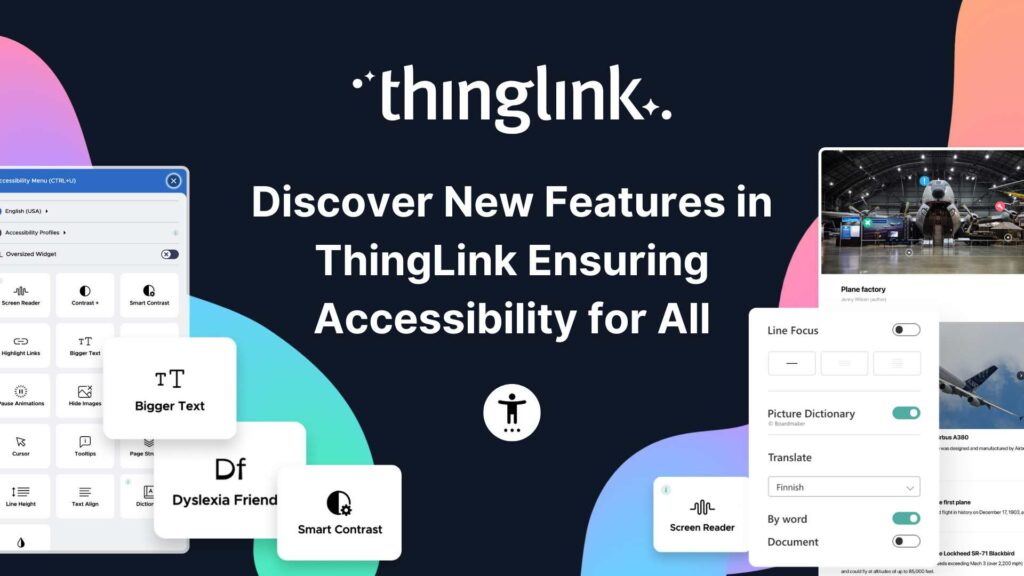
Creating accessible learning experiences is critical for educators, trainers and student creators, but it need not be daunting! ThingLink is a platform that allows...
¿Alguna vez has deseado llevar a toda tu clase a la selva amazónica, a la superficie de Marte o a los pasillos del Louvre o del Smithsonian… todo antes del ...
 Joseph Mayo
4 min read
Joseph Mayo
4 min read
Ever wished you could take your entire class to the Amazon rainforest, the surface of Mars, or the halls of the Louvre or the Smithsonian… all before lunch? ...
Joseph Mayo
4 min read
A medida que el aprendizaje inmersivo continúa transformando las aulas en todo el mundo, cada vez más escuelas y universidades están comenzando a explorar el...
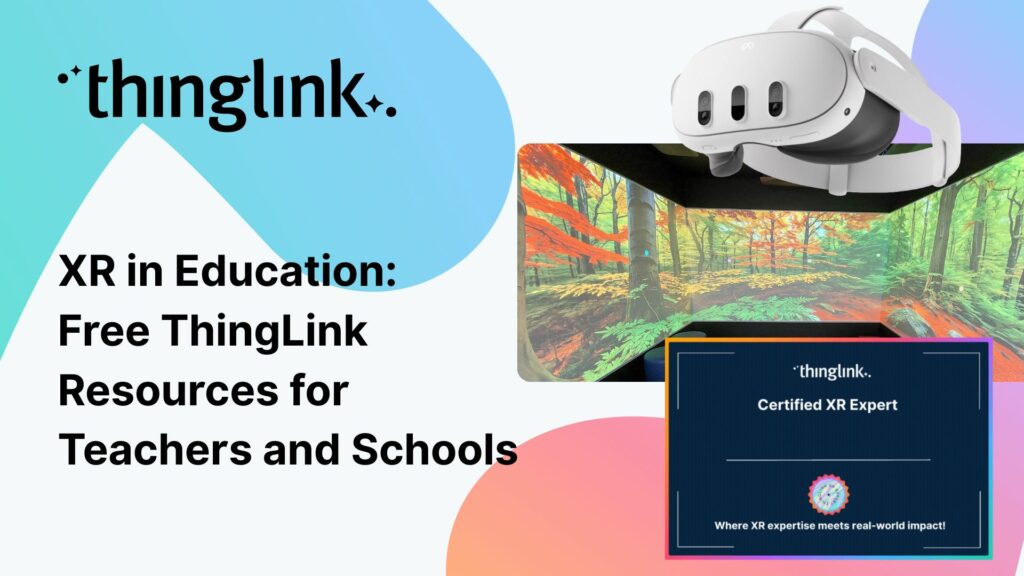
Para que tu camino en la creación de contenido educativo en XR sea lo más sencillo posible, hemos seleccionado una colección de recursos gratuitos que te ayudarán...
To make your journey through XR learning content creation as easy as possible, we’ve curated a collection of free resources that will help get you started. Packed...
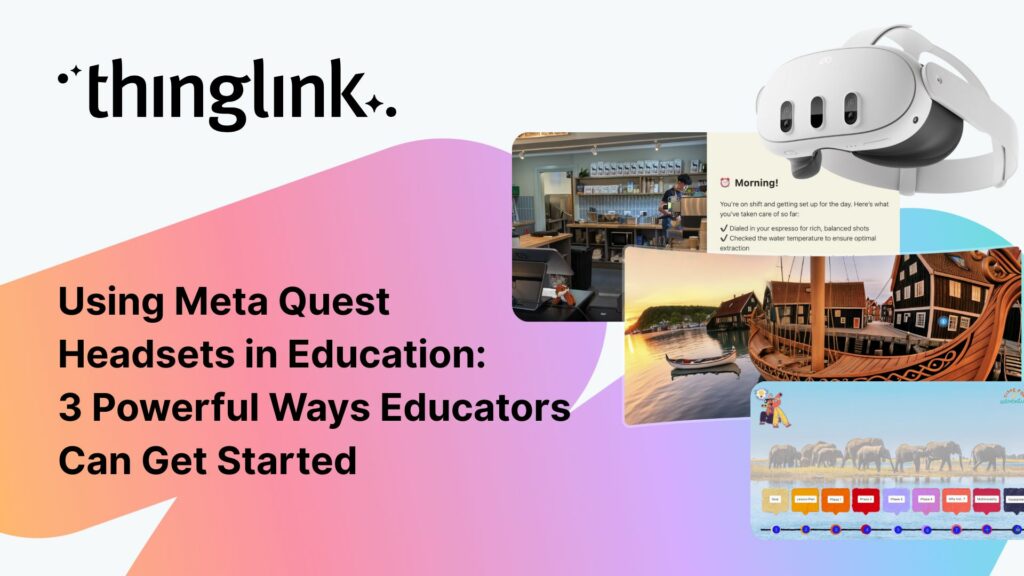
As immersive learning continues to transform classrooms around the world, more schools and colleges are beginning to explore the potential of Meta Quest headsets...
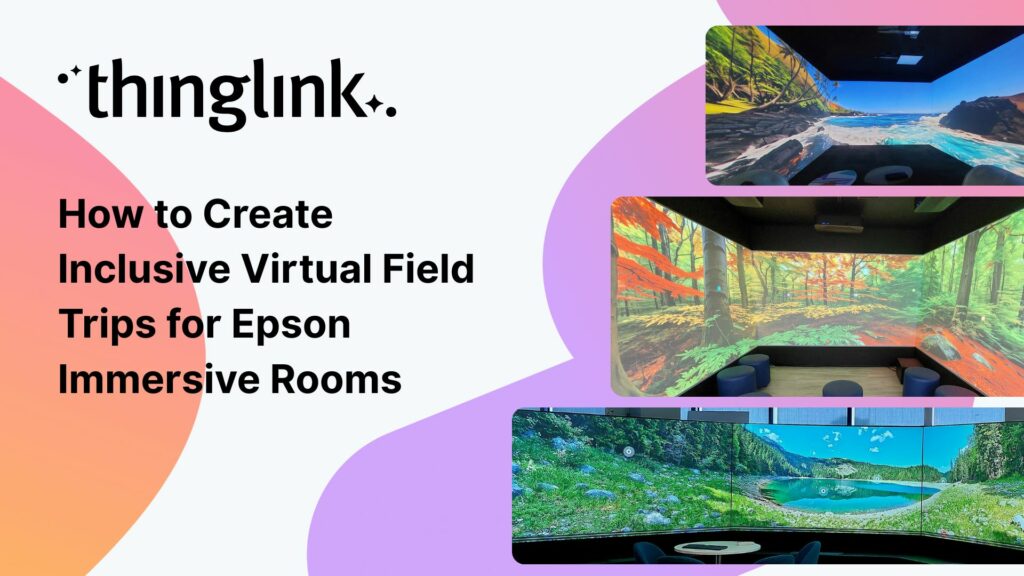
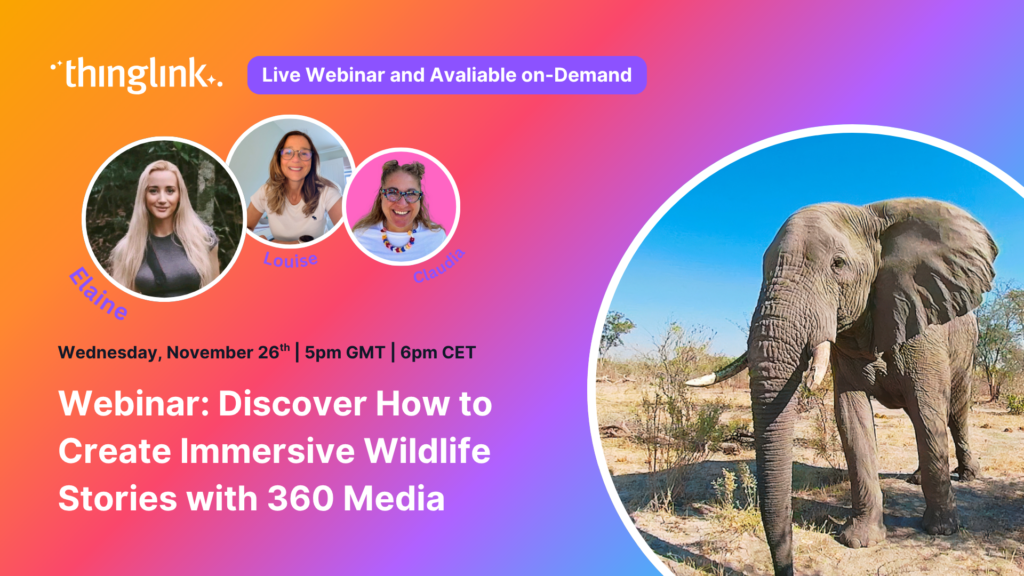
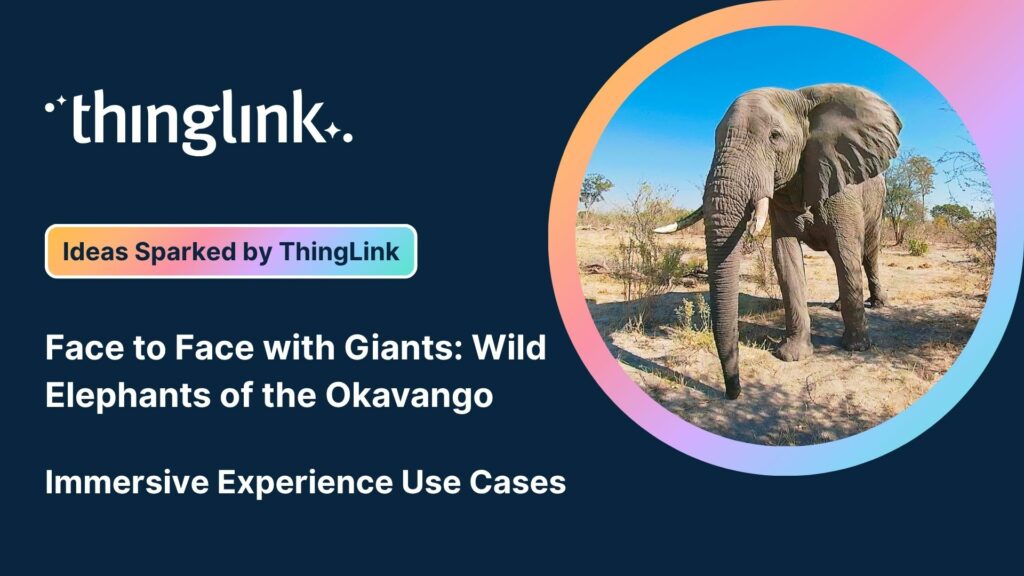
🐘 Inspire young minds to explore, protect and connect with nature using immersive storytelling, 360° content and ThingLink’s creative tools. Join us for an...
ThingLink has recently made available an inspiring set of three conservation-based 360° videos, designed for learners, educators, and anyone curious about how ...
Kyla Ball
4 min read
ThingLink is a fantastic tool for creating interactive and immersive images, videos, and virtual tours. It allows you to bring visuals to life by adding hotspots,...
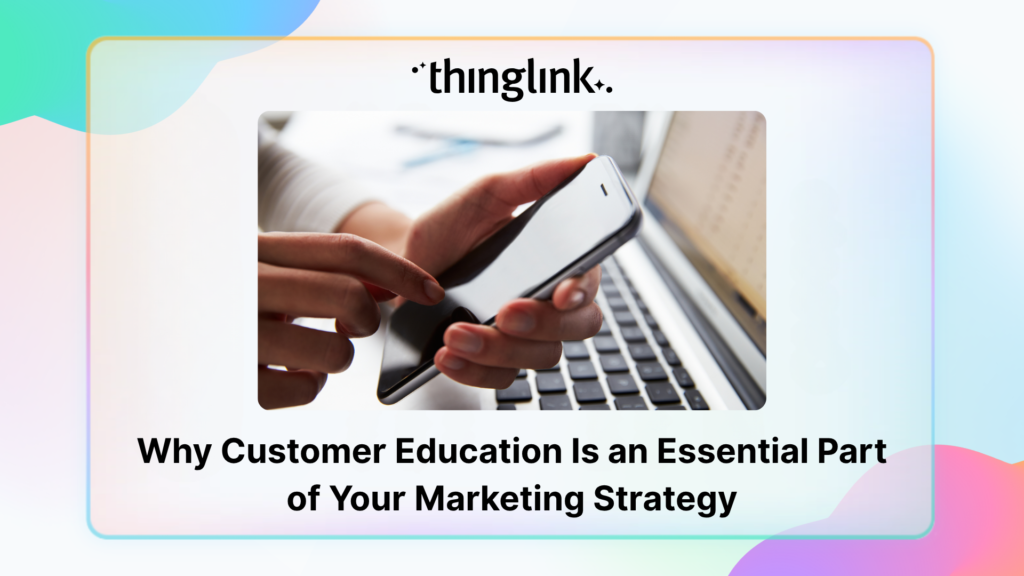
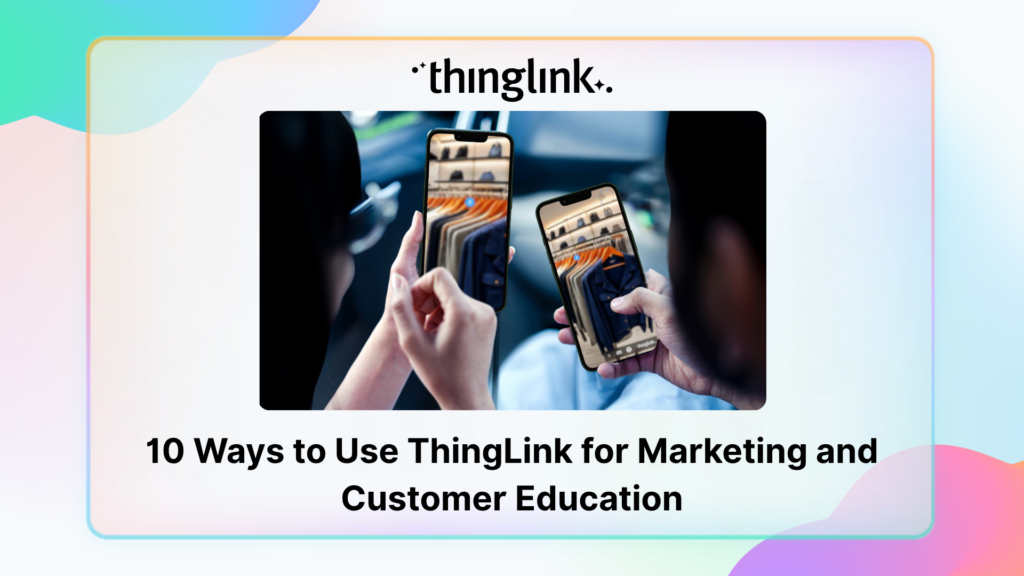
Customer education is core to marketing, not a separate tactic. It can be as simple as helping customers learn that your brand or product exists, or as deep as ...
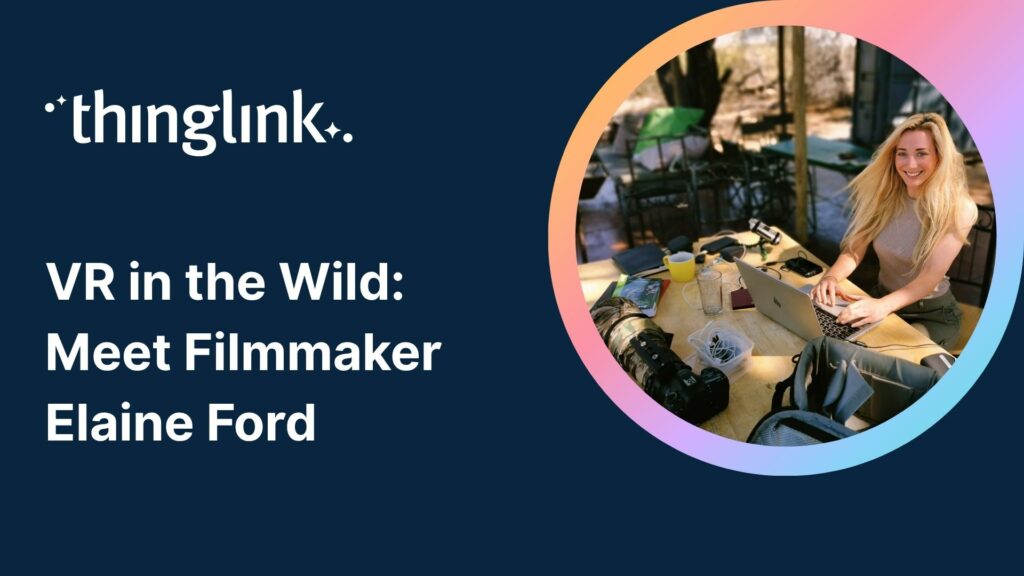
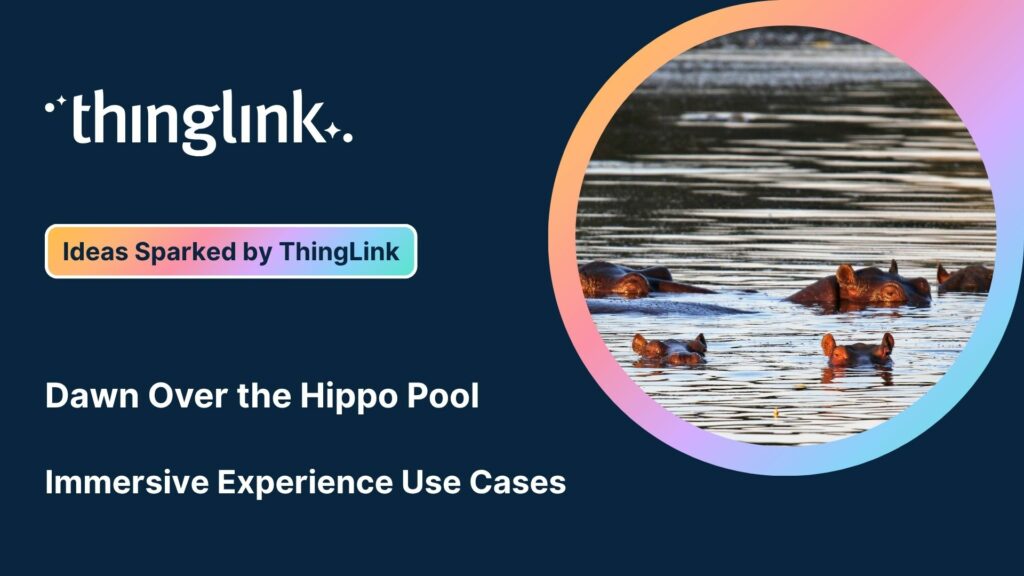
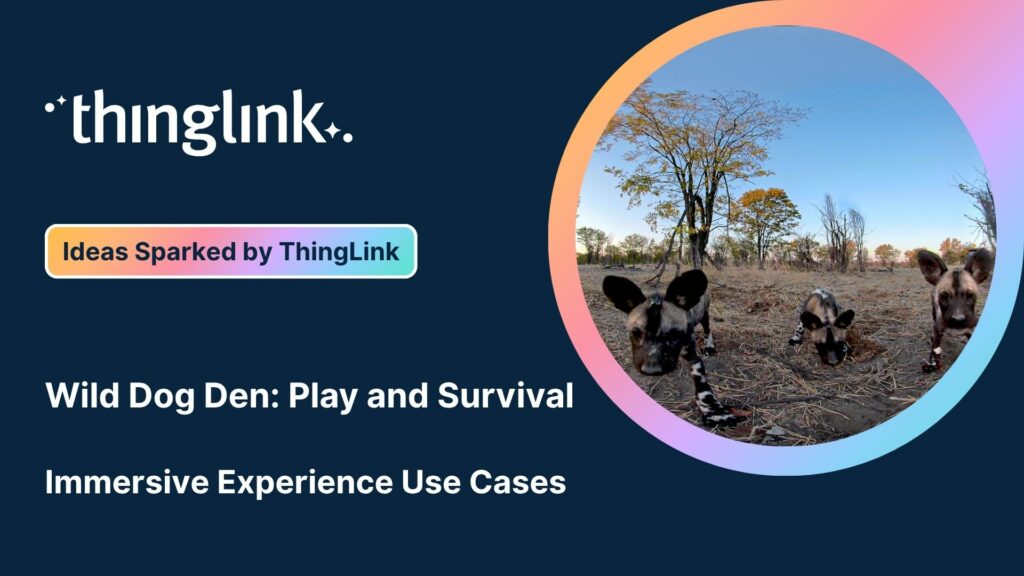
We’re delighted to collaborate with Elaine Ford to bring you a truly unique collection of 360° video footage captured in the wild. These immersive scenes offer...
We’re delighted to collaborate with Elaine Ford to bring you a truly unique collection of 360° video footage captured in the wild. These immersive scenes offer...
We’re delighted to collaborate with Elaine Ford to bring you a truly unique collection of 360° video footage captured in the wild. These immersive scenes offer...
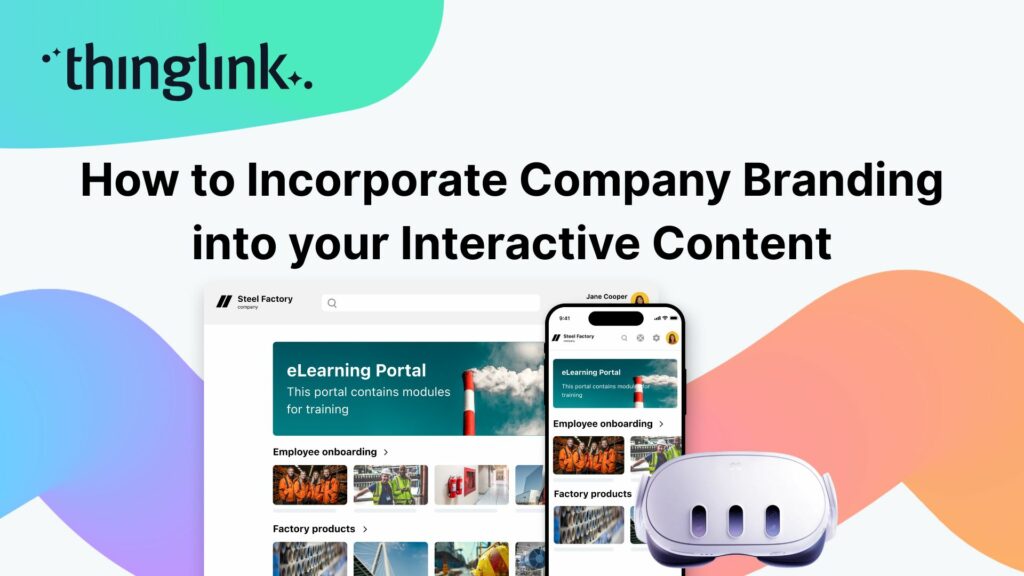
When creating any visual content for your business, it’s vital that your brand is reflected properly throughout the work. That goes for any content you create...
Are marketers a type of educator? As the Marketing Manager here at ThingLink, I’ve been pondering this question after I recently told one of my colleagues, “I...
 Louise Jones
11 min read
Louise Jones
11 min read