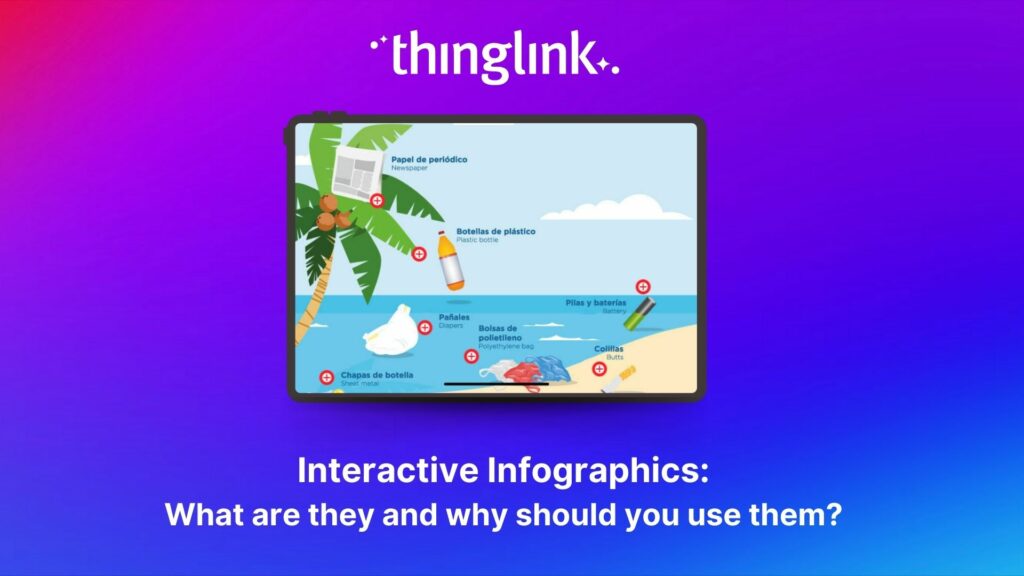
Join our mailing list to stay to date on our upcoming events
Thank you for subscribing!
  • Solutions
    • Marketing & communications
    • Teachers & schools
    • Higher education
    • eLearning & corporate training
    • Museums & libraries
    • Unity projects & 3D environments
  • Pricing
    • Marketing & communications
    • Education
    • eLearning & corporate training
  • Articles
  • Support
  • Blog in Finnish
  • Search for:
ThingLink logo
Blog
    • Solutions
      • Marketing & communications
      • Teachers & schools
      • Higher education
      • eLearning & corporate training
      • Museums & libraries
      • Unity projects & 3D environments
    • Pricing
      • Marketing & communications
      • Education
      • eLearning & corporate training
  • Articles
  • Support
Search for:
Log in Try for free
Blog tag: infographics
Featured picture of post "How to Create Interactive Infographic Insights in an Instant!"

How to Create Interactive Infographic Insights in an Instant!

We hope you are settling in to the new year! Now that we’ve had a chance to catch up from the holidays we’ve looked back at 2022 with a lens on our metrics. ...

Louise Jones 2 min read
Featured picture of post "Best Interactive Infographics"

Best Interactive Infographics

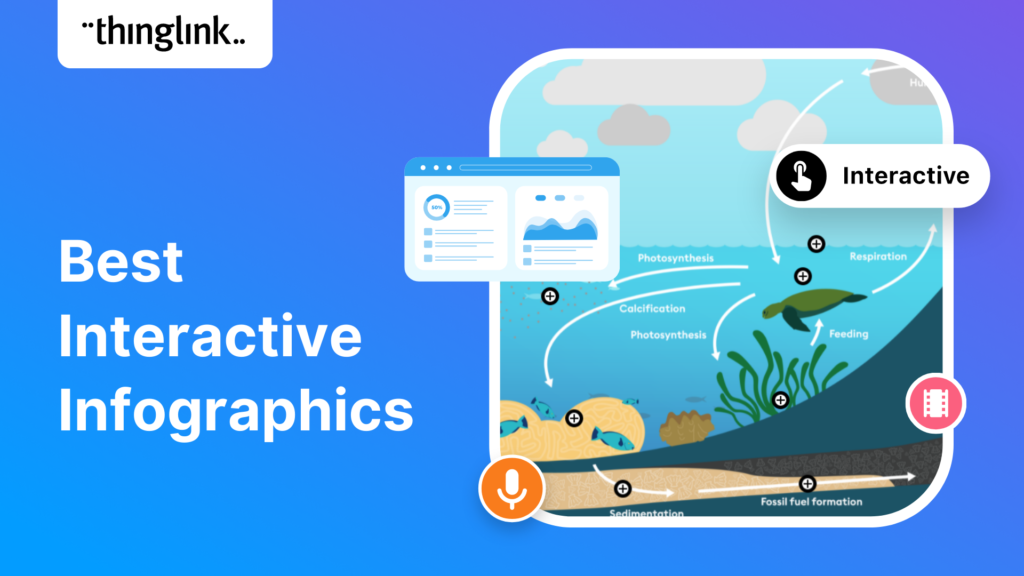
If you create or provide eLearning courses or workplace training, or you create any type of content marketing, you need to know how to use infographics. Infographics...

Louise Jones 4 min read
Featured picture of post "Classera offers a World-Class Immersive Learning Solution with ThingLink"

Classera offers a World-Class Immersive Learning Solution with ThingLink

ThingLink and global learning super platform Classera are today announcing they have developed a technical integration to offer educators a simple solution for ...

Louise Jones 2 min read
Featured picture of post "How to Make an Infographic on Canva"

How to Make an Infographic on Canva

1. What is an infographic? An infographic is a visual representation of complex information or data. It can include graphic elements such as icons, pie charts, ...

Louise Jones 4 min read
Featured picture of post "How to Make an Infographic in Canva"

How to Make an Infographic in Canva

1. What is an infographic? An infographic is a visual representation of complex information or data. It can include graphic elements such as icons, pie charts, ...

Louise Jones 4 min read
Featured picture of post "How to Make an Infographic Canva"

How to Make an Infographic Canva

1. What is an infographic? An infographic is a visual representation of complex information or data. It can include graphic elements such as icons, pie charts, ...

Louise Jones 4 min read

Posts navigation

1 2 Next

Create unique experiences with ThingLink! It's easier than you think! Start now
ThingLink logo
Terms of use Privacy policy Help center Contact us Blog in Finnish
Facebook logo Twitter logo YouTube logo Instagram logo