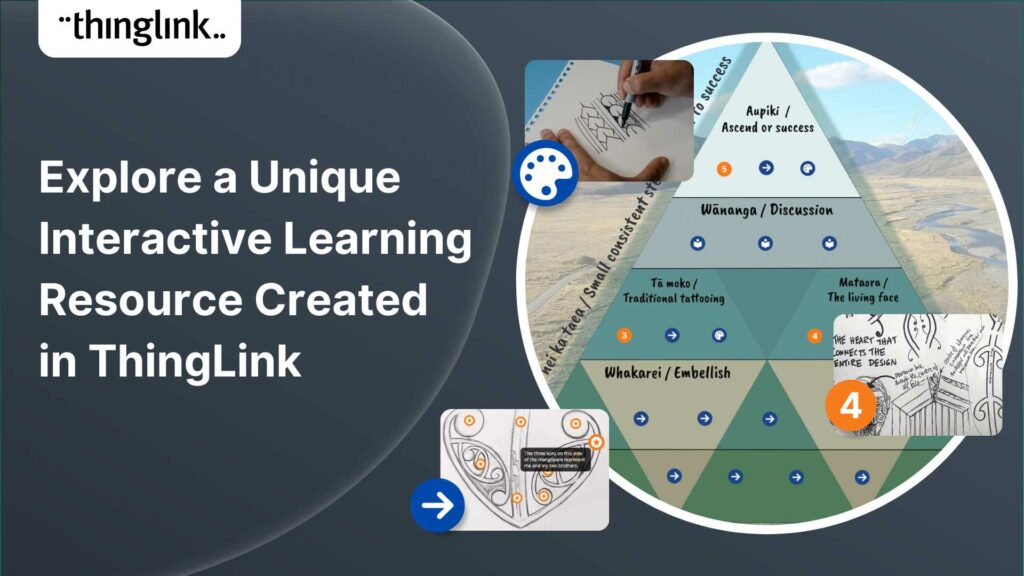
Katrina Lilly is a teacher at Te Aratai College in New Zealand, and recently finished a Masters in Contemporary Education at AcademyEx. As part of her masters she...
 Kyla Ball
6 min read
Kyla Ball
6 min read
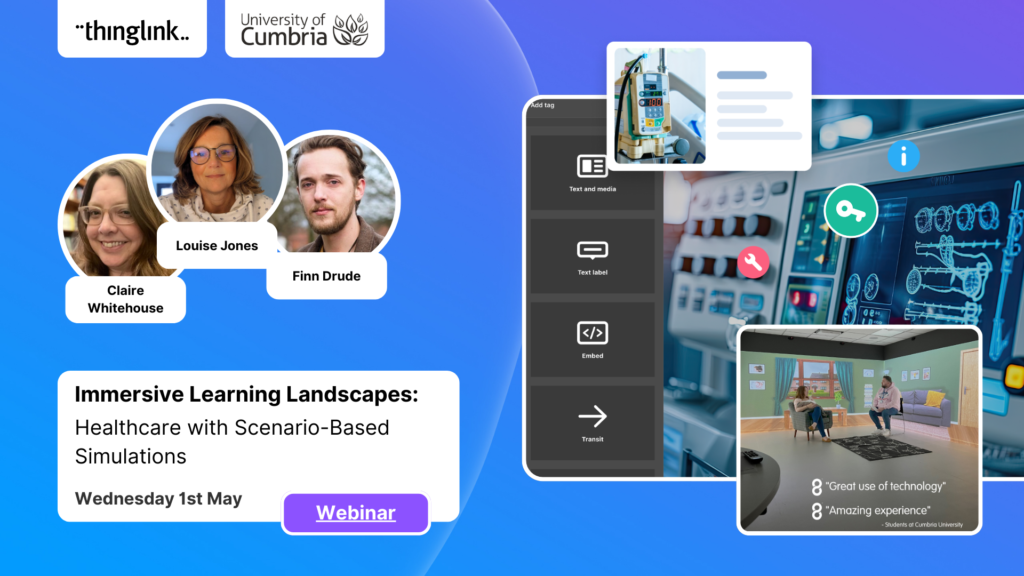
ThingLink has become an essential tool across numerous industries, making the learning experience more relevant and relatable at every stage. The impact in healthcare...
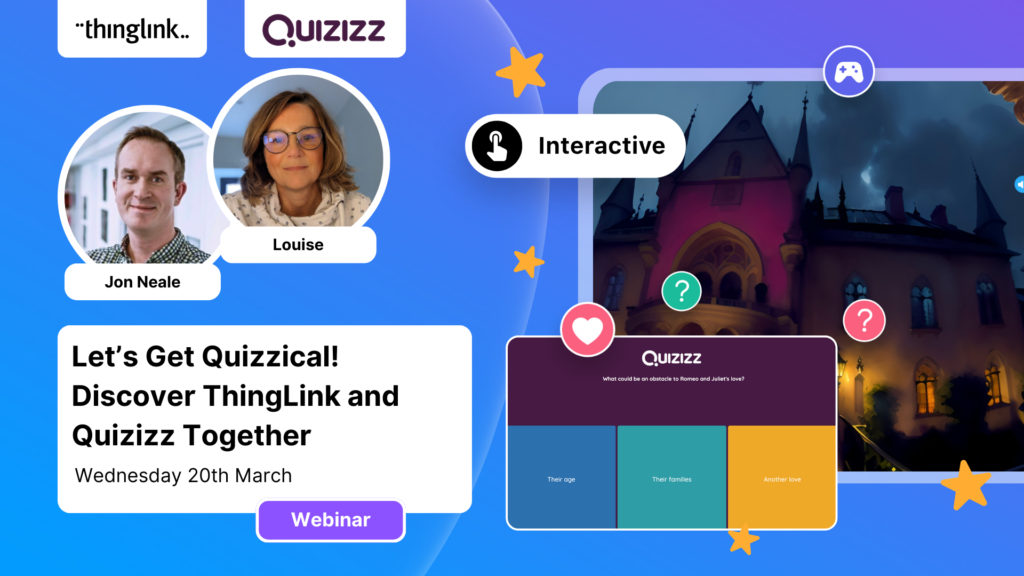
We are delighted to invite you to our webinar! ThingLink Host Louise Jones welcomed special guest star Jon Neale from Quizizz for a fun discussion and live demonstration...
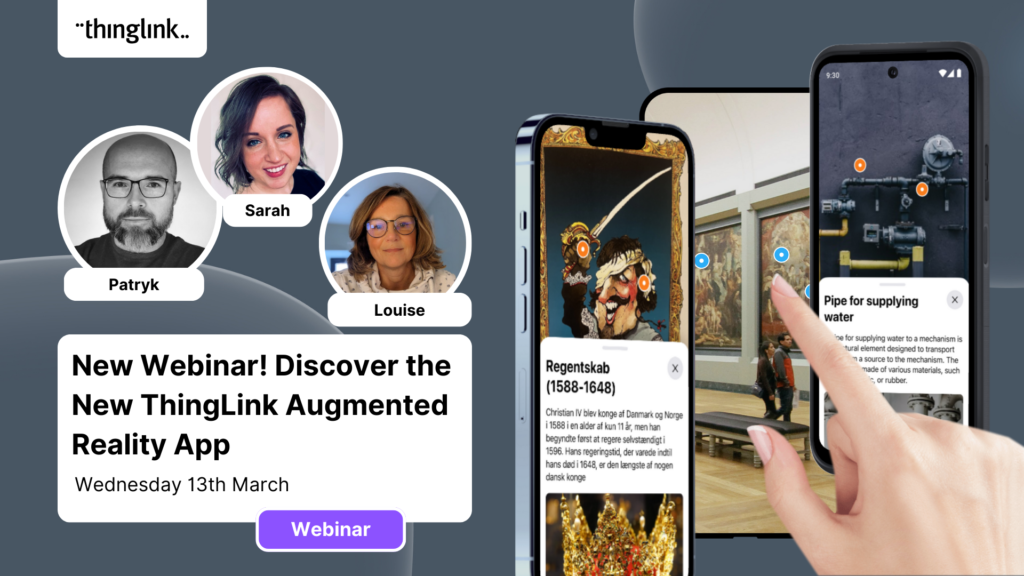
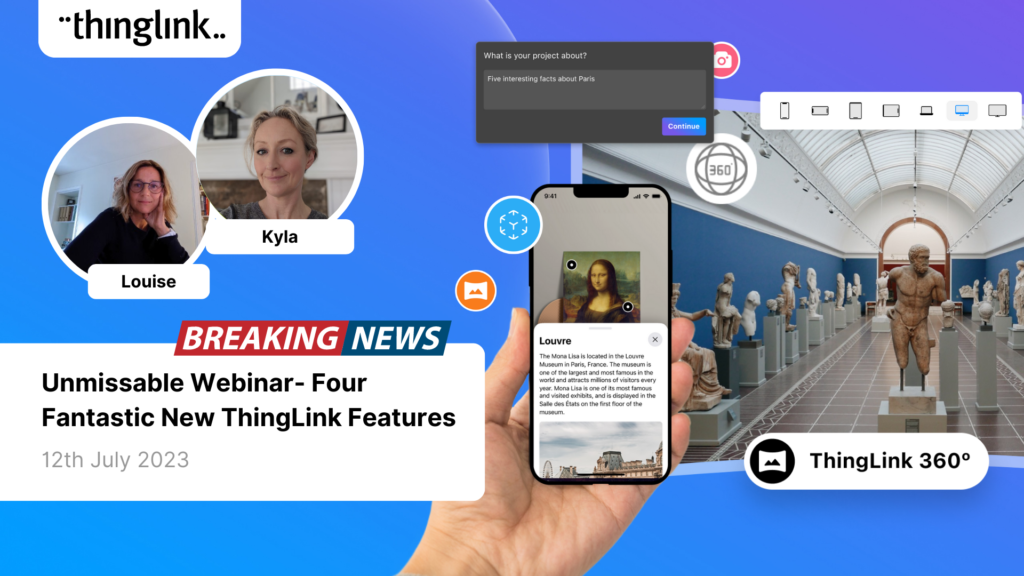
Discover the new ThingLink Augmented Reality App! In this exclusive free webinar Louise from ThingLink is joined by Special Guests Patryk Wójtowicz, Savonia University...
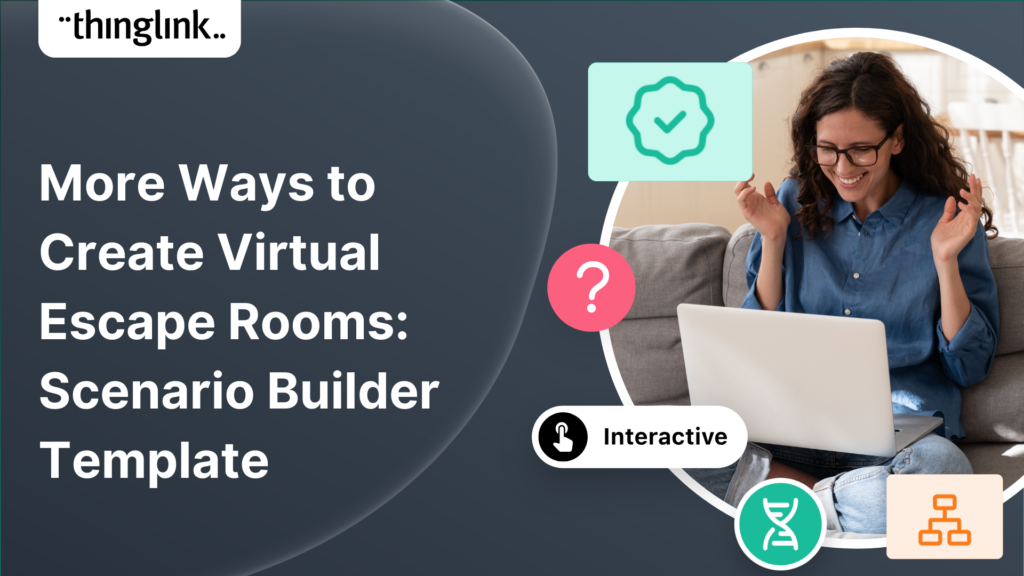
Creating a Virtual Escape Room is now even easier with ThingLink’s Scenario Builder ready-made template! Escape rooms (sometimes called breakout rooms) have...
Kyla Ball
4 min read
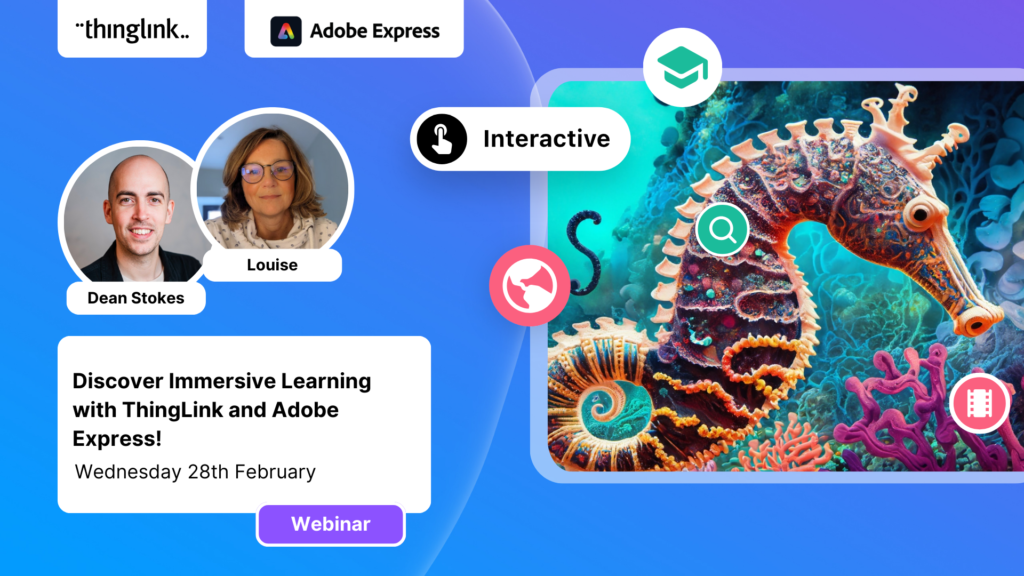
What a webinar! “Discover Immersive Learning with ThingLink and Adobe Express,” draws upon insights from the recent BETT Education Technology Show. ...
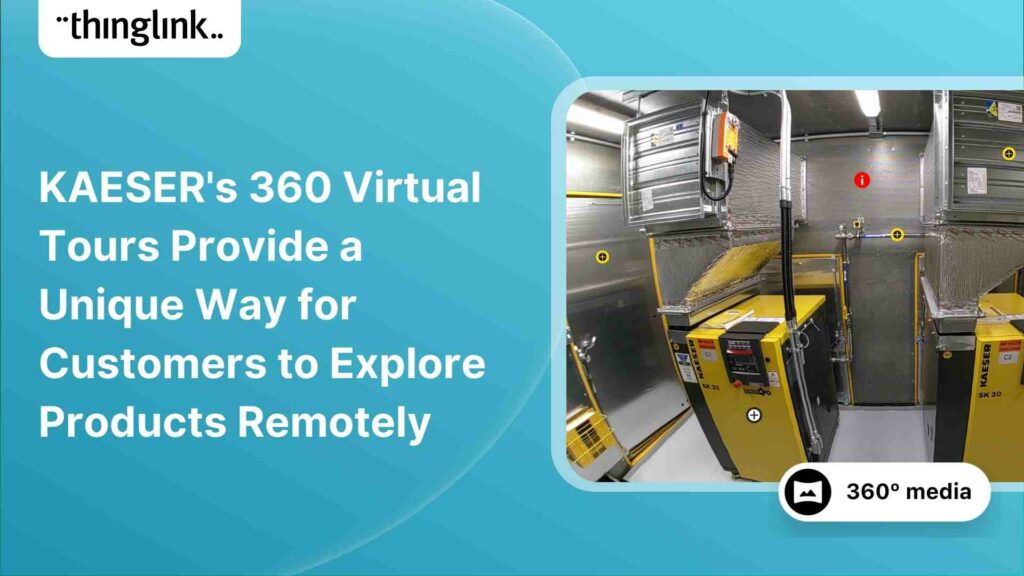
About KAESER KAESER Compressors is one of the world’s leading manufacturers and providers of compressed air products and services. They manufacture compressed ...
Kyla Ball
3 min read
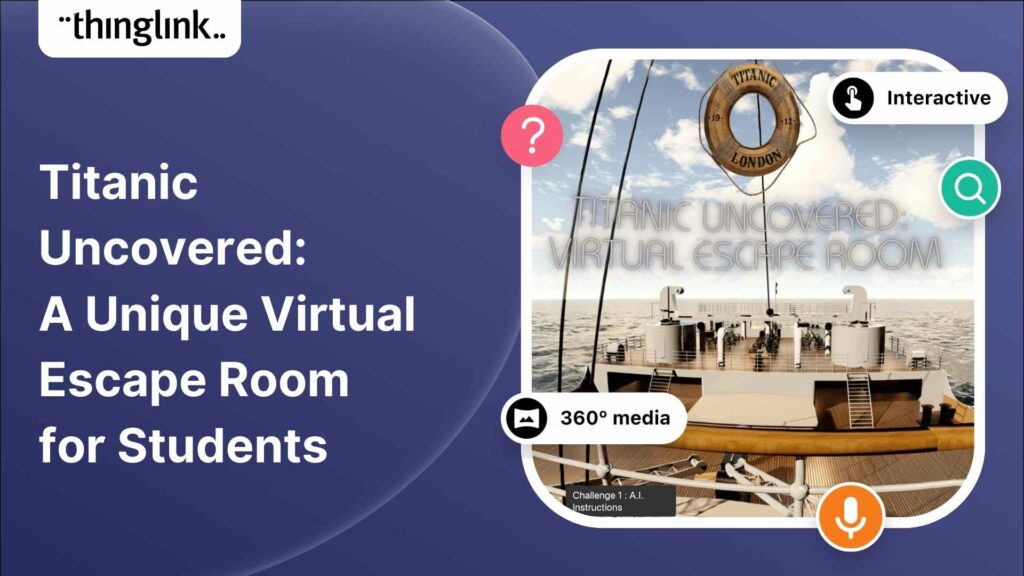
Educator Dwitney Bethel has created an incredible digital escape room using ThingLink’s Scenario Builder, set during the tragic maiden voyage of the Titanic...
Kyla Ball
8 min read
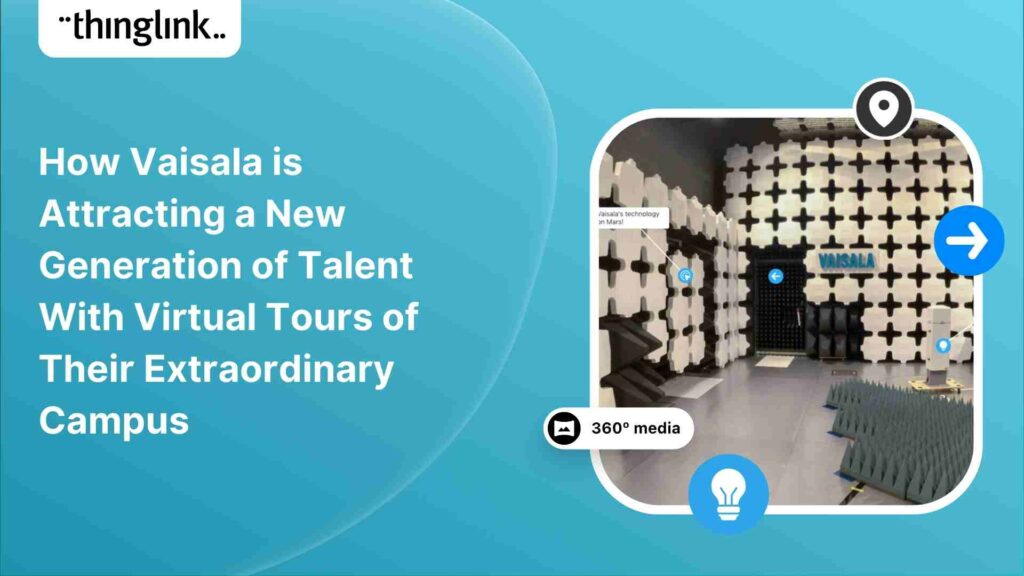
In this case study we look at how a global leader in weather and environmental measurements has opened up its incredible new R&D center and some of its other...
Kyla Ball
6 min read
Creating an online course or module is now easier than ever using Scenario Builder templates In the world of elearning and corporate training, creating engaging...
Kyla Ball
5 min read
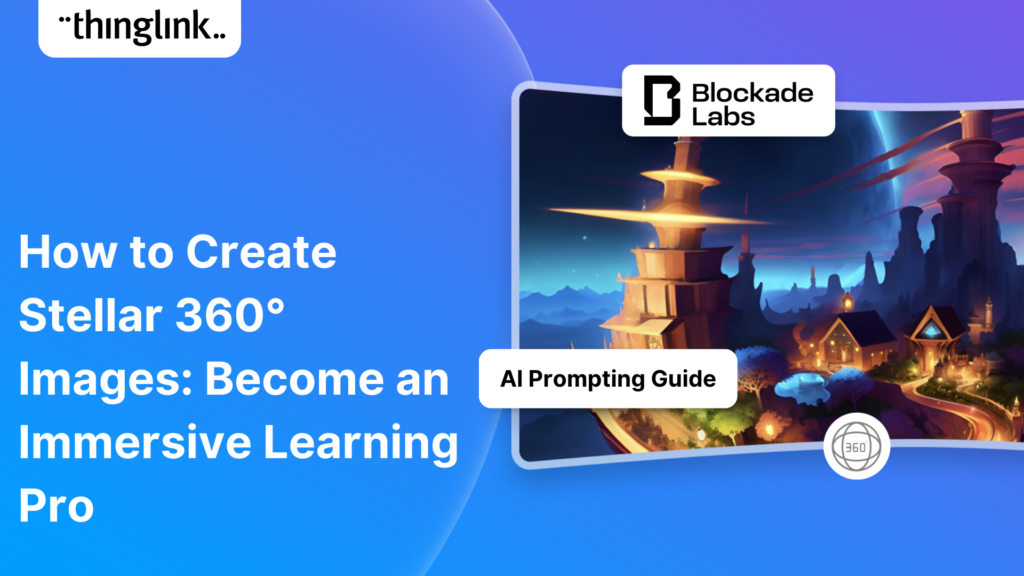
Unlock the Secrets to Crafting Mesmerizing 360° Visuals for a Game-Changing Learning Experience! The future of immersive learning is not just about consuming content—it’s...
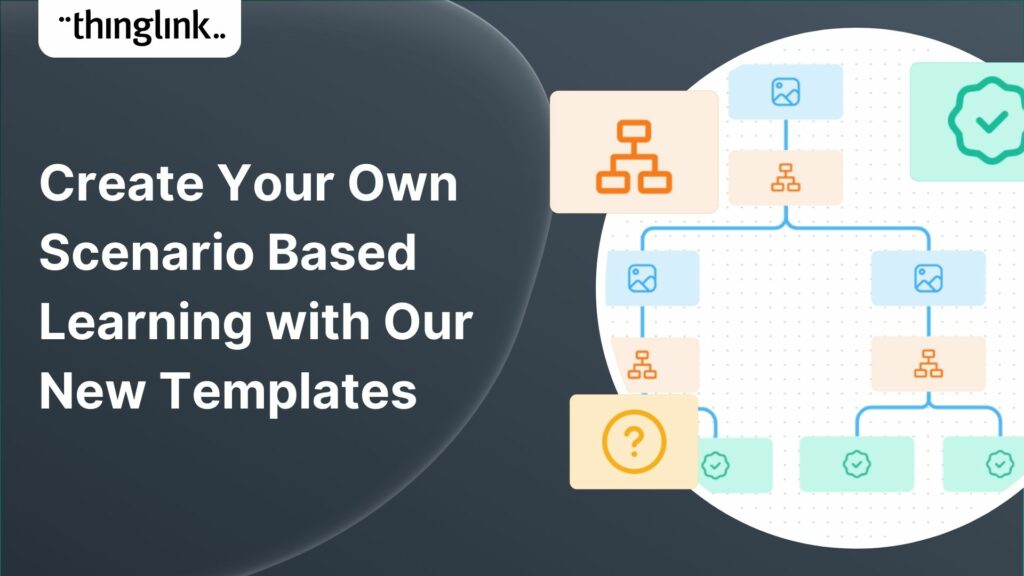
We recently launched ThingLink’s new Scenario Builder Templates – our latest tools to help you create impactful interactive training. In this blog we...
Kyla Ball
5 min read
ThingLink’s new Scenario Builder Templates are the newest arrival in our ever-growing set of assistant tools to help you build your own bespoke training and...
Kyla Ball
5 min read
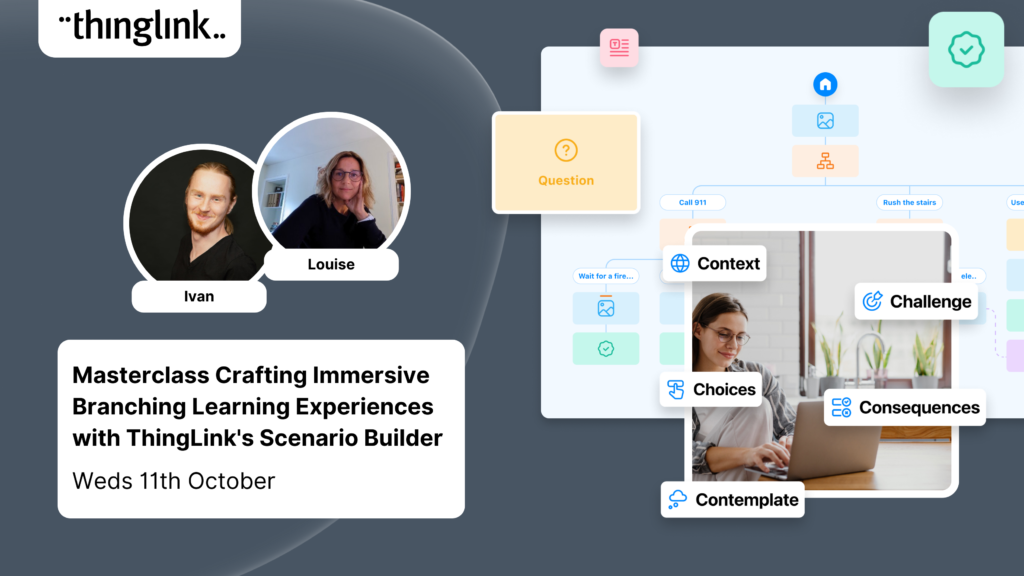
New Webinar! Masterclass in Crafting Immersive Branching Learning Experiences with ThingLink Scenario Builder In the world of eLearning, branching scenarios have...
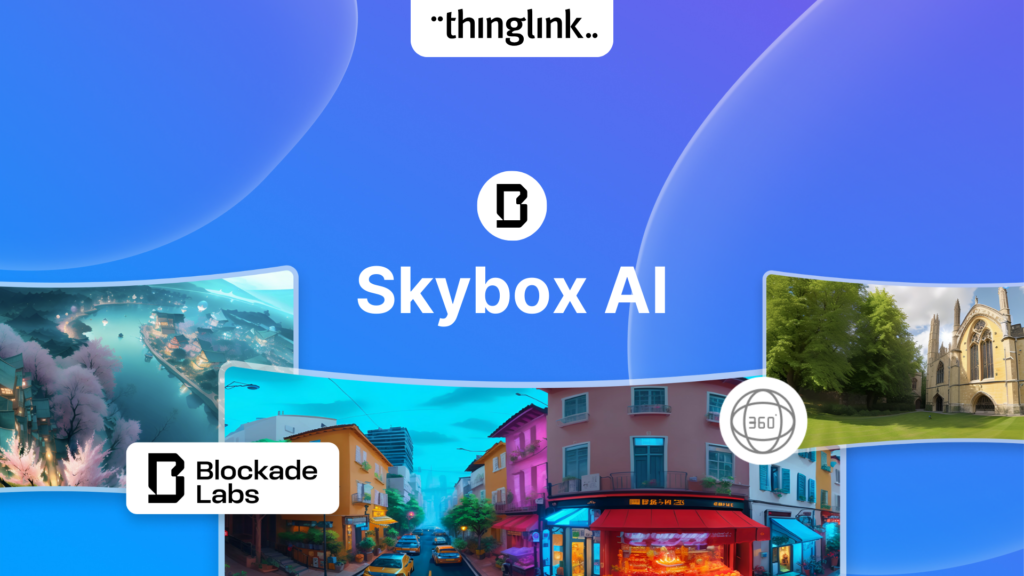
Unleash imagination to design unique environments inspired by literature, mythology, historical periods, and more. With Skybox AI and ThingLink, you’re not...
ThingLink, an award-winning immersive learning technology platform is announcing a strategic partnership with Blockade Labs, creators of Skybox AI, an innovative...
On-Demand Webinar on Advanced Features of ThingLink! Master ThingLink: Advanced Techniques for Crafting Next-Level Immersive Experiences The future of learning ...
We’re excited to unveil ThingLink’s new Scenario Builder Templates – the latest in a range of assistant tools to help you create amazing interactive...
Kyla Ball
6 min read
We’re thrilled to announce the launch of our much-anticipated feature: the Icon Color Picker! This great new update comes as a direct response to the invaluable...
Learning Tools Interoperability (LTI) is a widely-adopted industry standard in the fields of education and corporate learning and development. It was developed ...
Virtual training and elearning has undoubtedly revolutionized the delivery of corporate training and learning. It offers both employees and employers the benefits...
Kyla Ball
10 min read
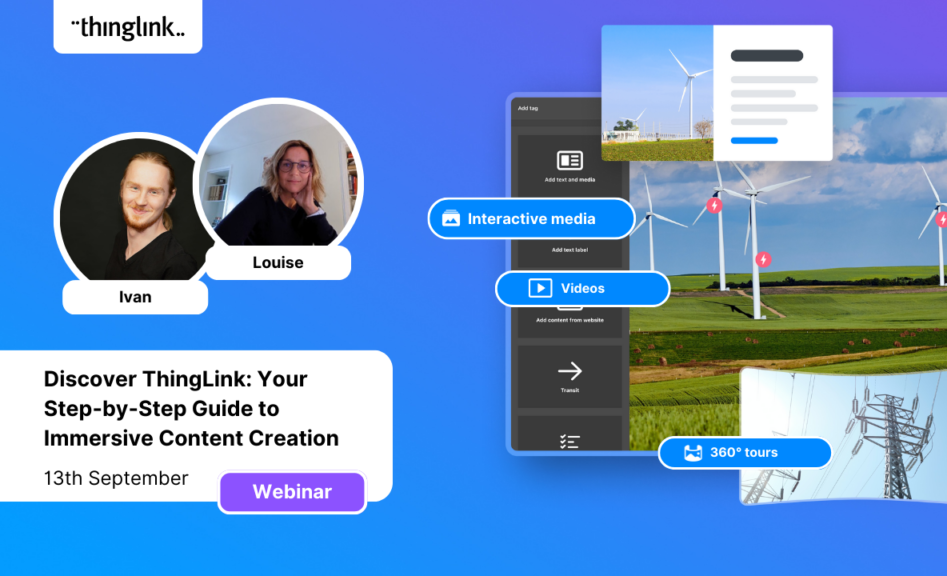
Dive into “Discover ThingLink: Your Step-by-Step Guide to Immersive Content Creation.” This webinar introduces ThingLink, a game-changing platform that...
In the early 2000s, the first digital cameras hit the market. In those days, we paid hundreds to take low resolution pictures with hardware that could only store...
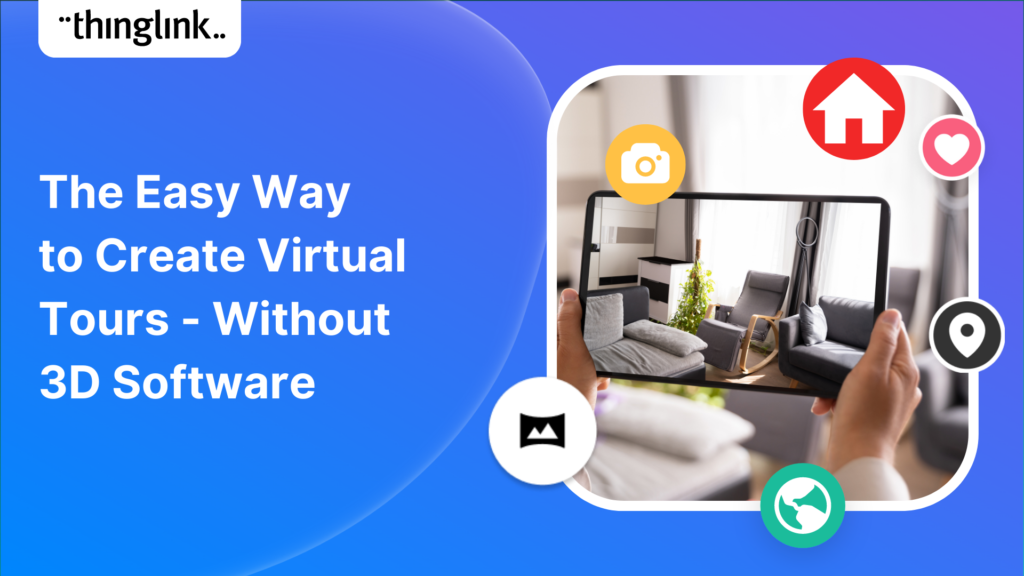
In the wake of the deprecation of Google StreetView Camera App, virtual tour creators everywhere have been looking for a user-friendly, high-quality and accessible...
Kyla Ball
3 min read
At ThingLink, we believe that the creation and sharing of 360-degree photos should be possible for anyone, anywhere. In this blog we’re giving a tutorial ...
Kyla Ball
3 min read
At ThingLink we are constantly striving to source and share with our creators the very best and most useful AI tools. To meet our criteria they must produce high...
Kyla Ball
6 min read
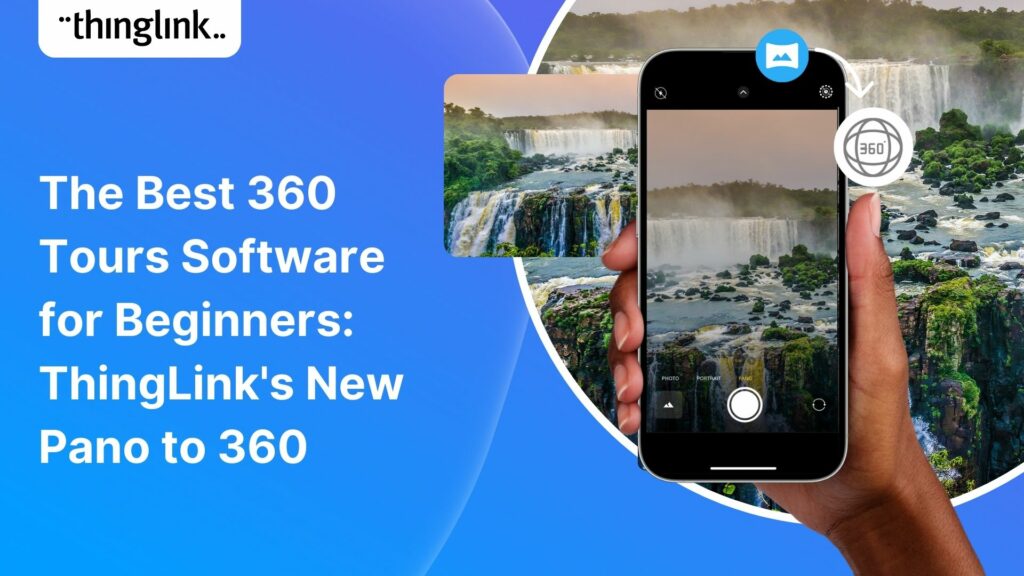
Dive into a universe of detail with Pano to 360: no more multiple shots, just easy, fully immersive 360 photospheres! Since Google decided to retire the beloved...
Ever since Google discontinued its much-loved Street View Camera App, users around the world have been searching for a worthy alternative. The good news? Your search...
Artificial intelligence (AI) has become seamlessly integrated in one way or another into almost all the business processes and support systems that we take for ...
Kyla Ball
4 min read
Virtual field trips are an ideal way to immerse learners in real world environments without ever leaving the classroom, lab or lecture theatre. There are a number...
Kyla Ball
6 min read
ThingLink introduces Pano to 360: a revolutionary and cost-effective solution for capturing 360 images – using an iPhone or android mobile device. Join our...
Kyla Ball
2 min read
Everyday applications of AI We are living in an era where artificial intelligence (AI) is becoming a seamless part of many aspects of our daily life. Whilst we ...
Kyla Ball
4 min read
Virtual tours are now one of the cornerstones of real estate marketing, giving potential buyers the opportunity to view a property at a convenient time and place...
Kyla Ball
3 min read
ThingLink Launches a Revolutionary Solution for Capturing 360 Images In light of the discontinuation of the Google Street View Camera app, ThingLink has answered...
Kyla Ball
2 min read
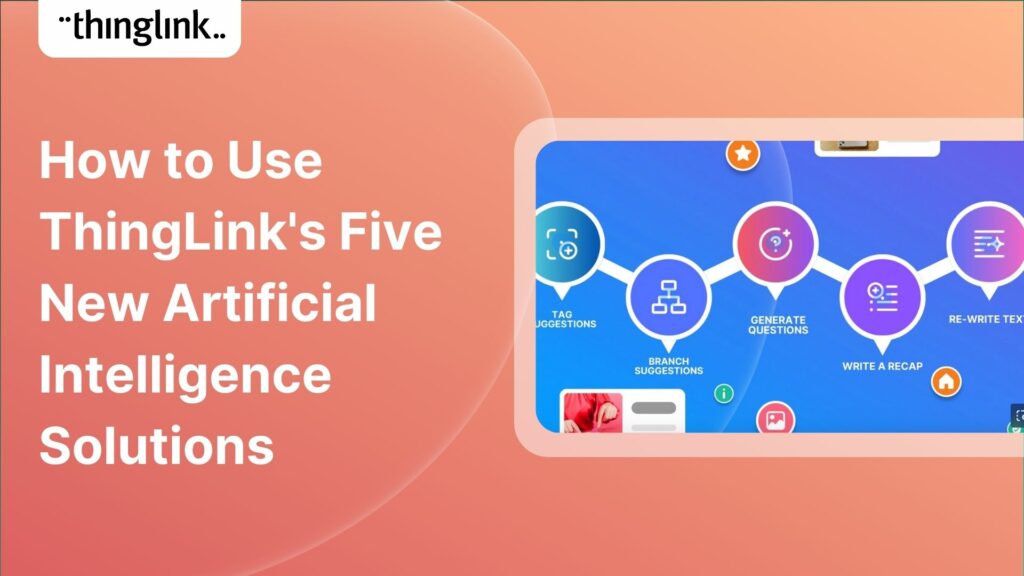
Earlier this year, we launched an exciting group of webinars, to engage with ThingLink creators and explore how AI solutions could be integrated into their work....
Kyla Ball
3 min read
QR codes are having a renaissance – and it’s well deserved! These versatile squares offer endless opportunities for creativity and engagement. In this...
Kyla Ball
6 min read
ThingLink has been a leader in learning technologies, consistently seeking innovative ways to stay ahead of the curve. Not only are we bringing you new ways to ...
Earlier this year, our team initiated a series of webinars, fostering a dialogue with creators on the integration of Artificial Intelligence (AI) tools into their...
An effective marketing communications strategy is crucial for the success of any company, of any size. But for a small business or start up with no marketing team...
Kyla Ball
4 min read
Virtual tours have become an integral part of the real estate industry, allowing potential buyers to explore properties from the comfort of their homes – ...
Kyla Ball
5 min read
In this blog we look at what digital storytelling is, how it is being used, and provide three great examples of how ThingLink has been used for storytelling projects...
Kyla Ball
4 min read
In this blog we look at how you can use interactive videos – either as a training or educational tool for your learners, or for marketing or ecommerce purposes....
Kyla Ball
4 min read
Artificial Intelligence (AI) tools are rapidly evolving and one of the most fascinating and incredibly useful applications is image generation, particularly text-to-image....
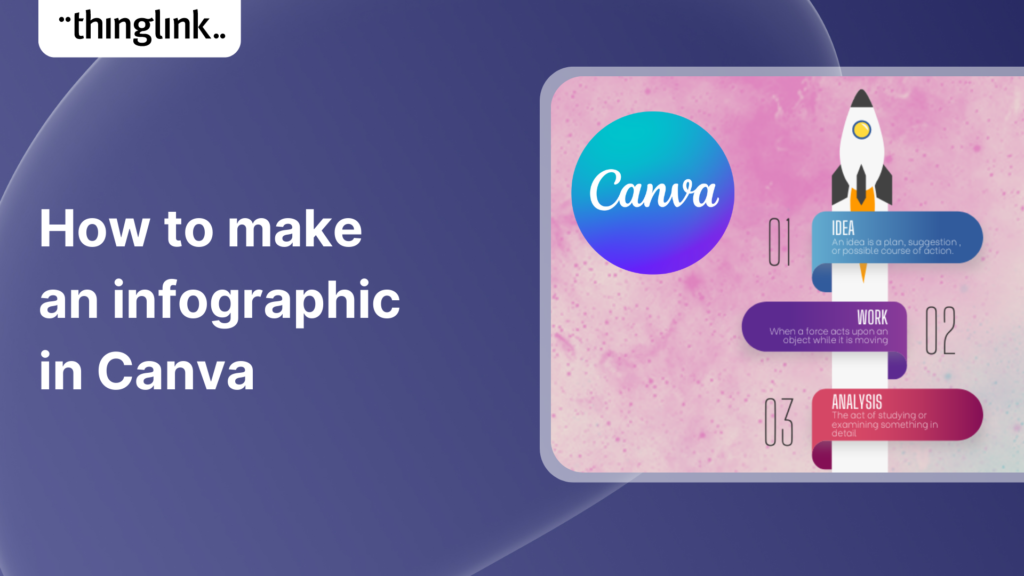
Infographics are a great way to present complex information in a clear and concise way. They are used for data visualization across every sector and can package...
Kyla Ball
4 min read
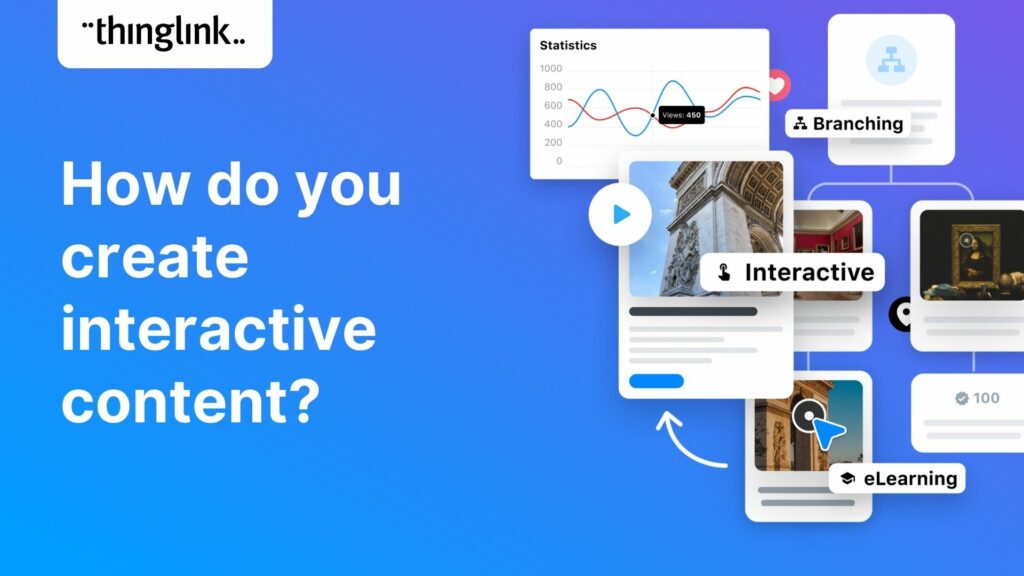
ThingLink is used all over the world as a tool to easily create interactive learning experiences with images, video and 360 images. But one way to create a valuable...
Kyla Ball
5 min read
In this blog we have put together a little toolbox of 7 creative thinking skills to help you boost creativity in your everyday life and work. It’s a common misconception...
Kyla Ball
4 min read
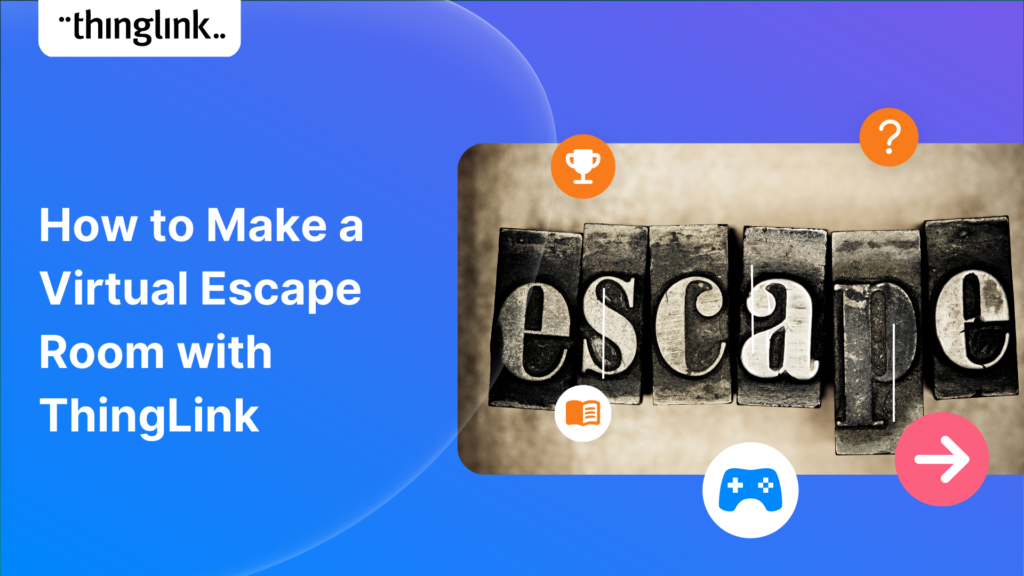
Virtual escape rooms are a great way to engage K-12 students in learning, and offer a unique and interactive learning experience. Just like physical escape rooms,...
Kyla Ball
6 min read
In this short blog we look at how storytelling has developed from its earliest forms to the ultra-short form content that we interact with, multiple times per day,...
Kyla Ball
5 min read
What is Immersive Learning? Immersive learning is a modern approach to education and training that aims to create a fully-engaging and experiential environment ...
Kyla Ball
5 min read
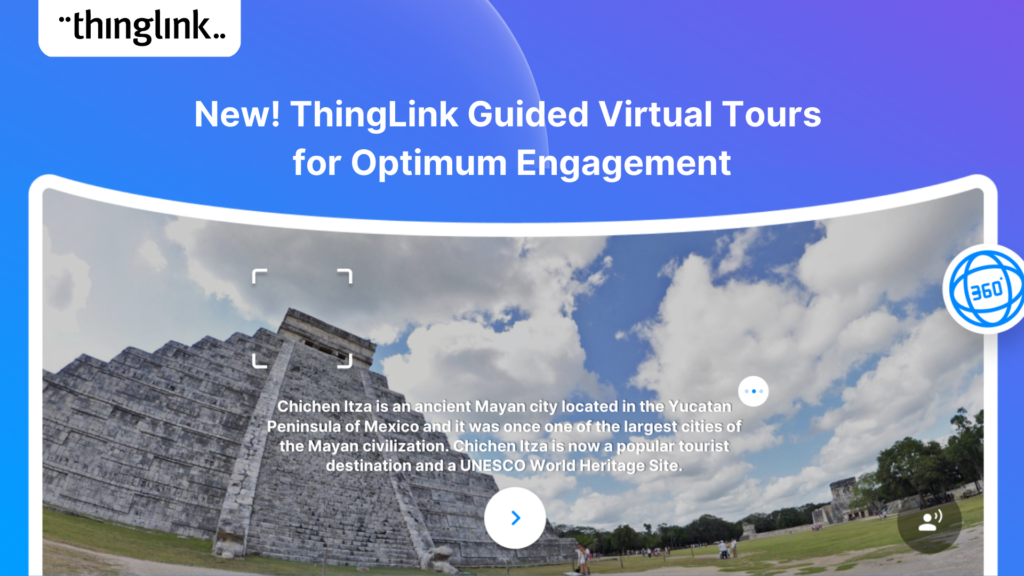
Today, ThingLink announces a new product: Guided Tours. Here is a quick summary of what it is, why we built it, and how it can help instructors and learners to ...
The action replay is now available! Have you ever wondered how to offer more structure in your virtual tours, trips or experiences? We are delighted to say that...
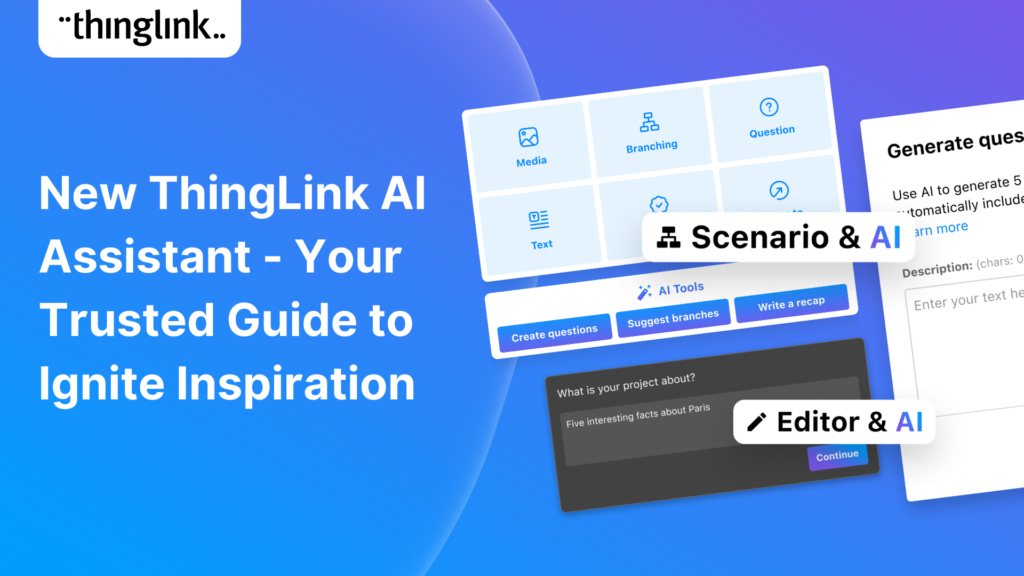
ThingLink has been a leader in learning technologies, consistently seeking innovative ways to stay ahead of the curve. When it comes to AI, we wish to take a more...
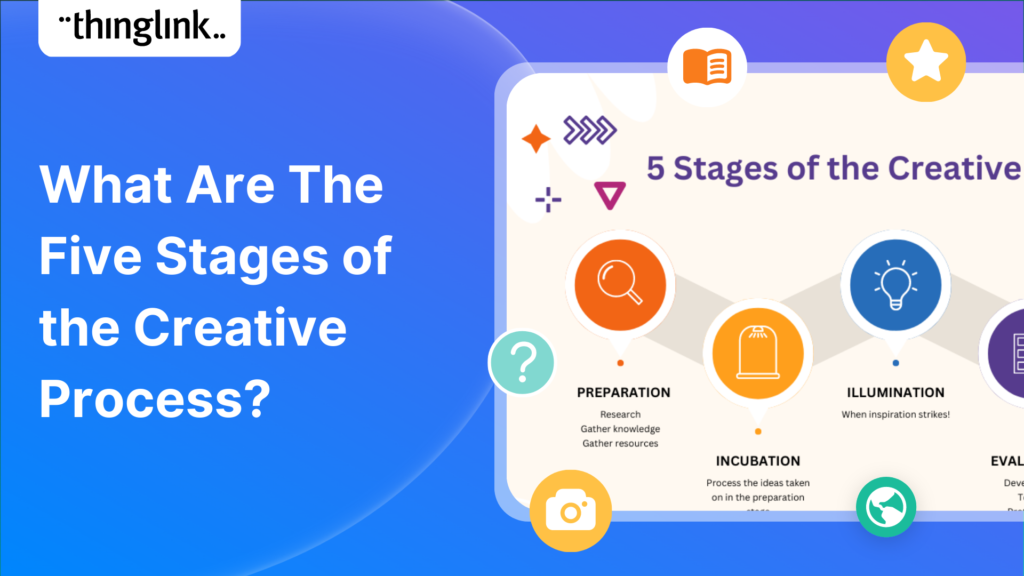
Creativity is required to a greater or lesser degree in almost all projects. Whether it is writing, designing, or strategizing, creativity is what gives birth to...
Kyla Ball
3 min read
Have you ever wondered how to offer more structure in your virtual tours, trips or experiences? We are delighted to say that ThingLink is announcing the perfect...
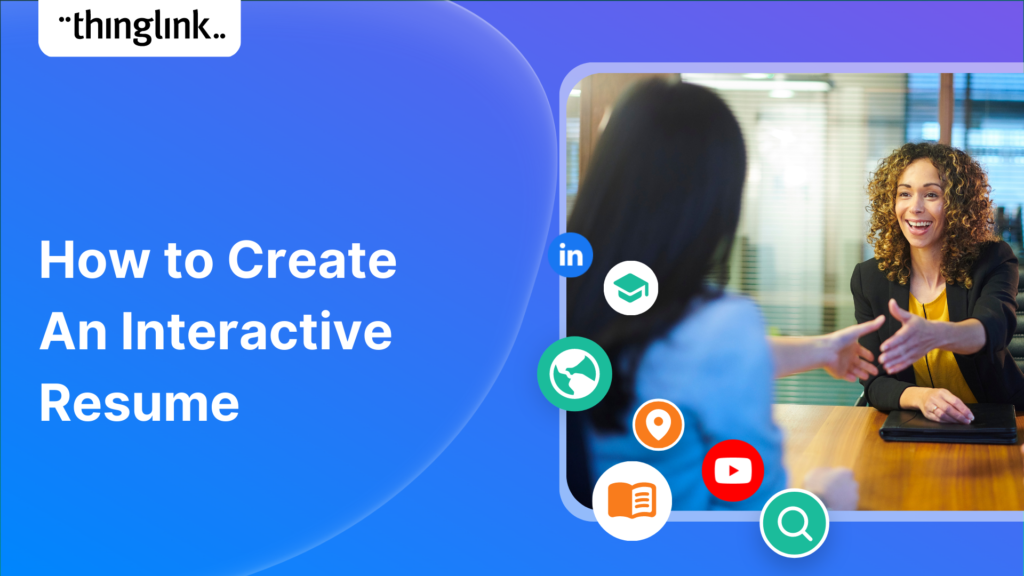
These days, a standard resume or CV may not be enough to stand out amongst other applicants in your job search. This is where interactive visual resumes come in....
Kyla Ball
5 min read
In recent months, GPT3 has moved out of the tech news sections and into the headlines. But what is it exactly? How does it work and why has it become such a hot...
Kyla Ball
5 min read
What is an interactive resume? An interactive resume or interactive CV (curriculum vitae) is a tool that contains rich media in a variety of formats. It goes beyond...
Kyla Ball
4 min read
Mitigate Risk with Two Factor Authentication ThingLink has released a new feature enabling ‘Login Verification’ for your individual account and also as a setting...
Can you create an escape room virtually? The answer is yes – and much more easily than you may think! In recent years, physical escape rooms or breakout rooms...
Kyla Ball
5 min read
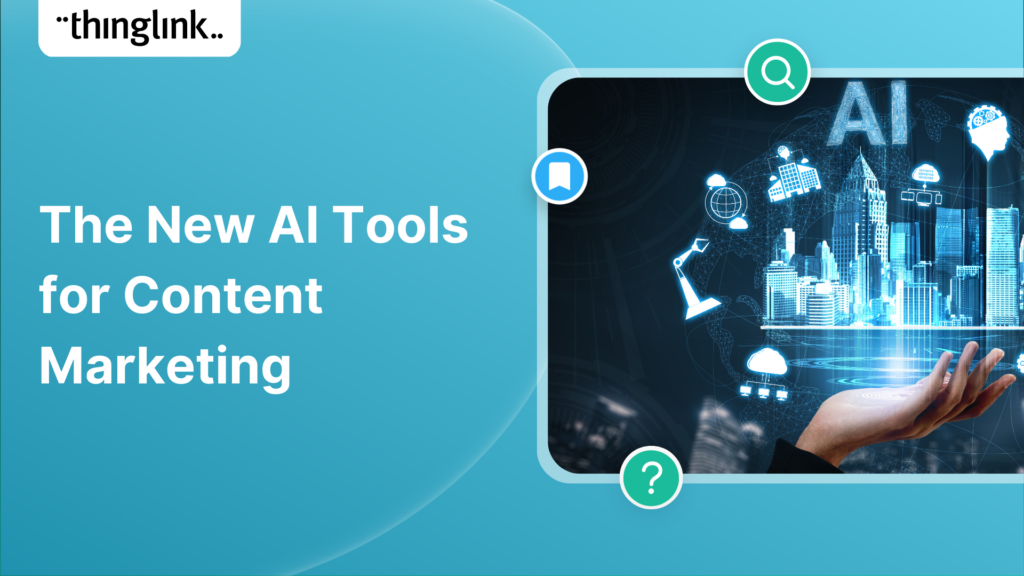
Why is content marketing important? Content marketing is a powerful tool for businesses to reach and engage their target audience. It’s the cornerstone of...
Kyla Ball
4 min read
What is content marketing? Content marketing is a strategic approach to creating and distributing valuable content that is designed to build relationships with ...
Kyla Ball
3 min read
What is content marketing? Content marketing is a powerful strategy that businesses of all sizes can use to build an engaged audience and generate more leads. It...
Kyla Ball
4 min read
Content marketing has become an integral part of any successful business strategy, regardless of business type or size. It helps to create relationships, build ...
Kyla Ball
4 min read
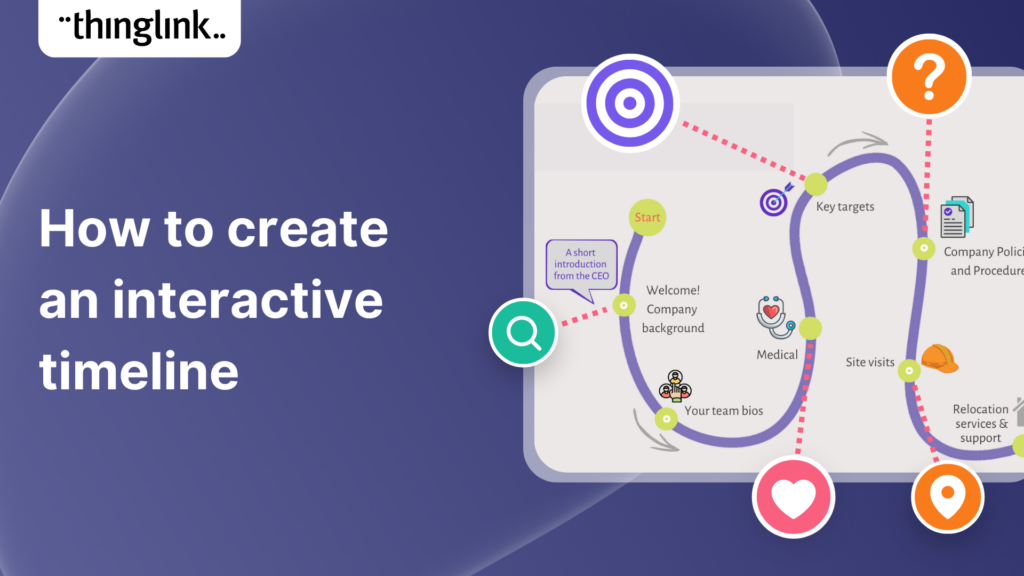
Creating an interactive timeline can be a great way to engage your learners and add another level of interest to your story. In this blog we show you how to easily...
This week we have especially great news FOR YOU, our wonderful community and our team. In this special round-up we bring news of our stand-out achievements this...
If you create or provide eLearning courses or workplace training, or you create any type of content marketing, you need to know how to use infographics. Infographics...
Twitter is a powerful social media tool for large and small businesses, but many struggle to use it effectively. Creating interactive posts is a great way to engage...
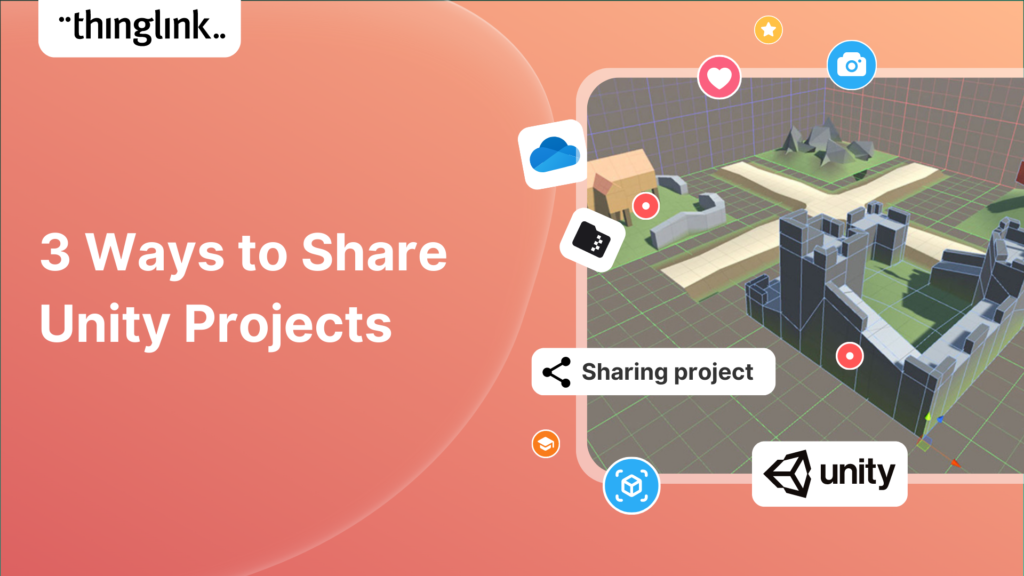
If you are a developer working on a Unity project, at some point you most likely want to share it with another user for feedback. If the other user has the same...
As a business owner who is already using a digital marketing strategy, you’ll know that social media is an excellent way to reach new customers and grow your...
1. What is an infographic? An infographic is a visual representation of complex information or data. It can include graphic elements such as icons, pie charts, ...
How to Create an Effective Communication Strategy and Master Strategic CommunicationsThis post shows the key features of planning an effective communication strategy,...
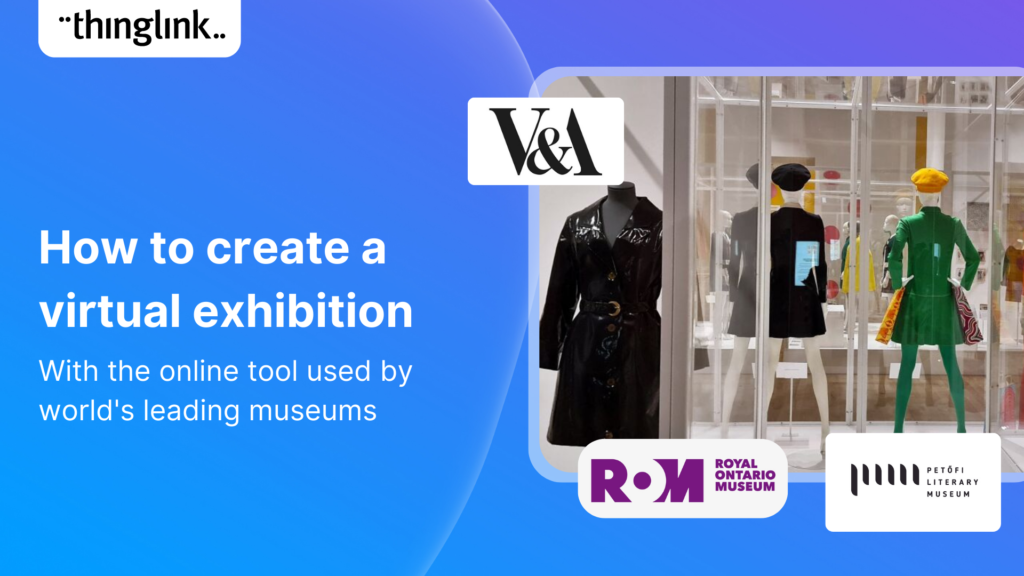
Regardless of size, museums worldwide face challenges related to funding, staffing, and audience engagement. One way that museums are overcoming these challenges...
Kyla Ball
7 min read
Creating an interactive timeline can be a great way to engage your audience and add another level of interest to your story. In this blog we show you how to easily...
What are interactive presentations? In business, education and the cultural sector, presentations are a common way to share information and ideas. But what if your...
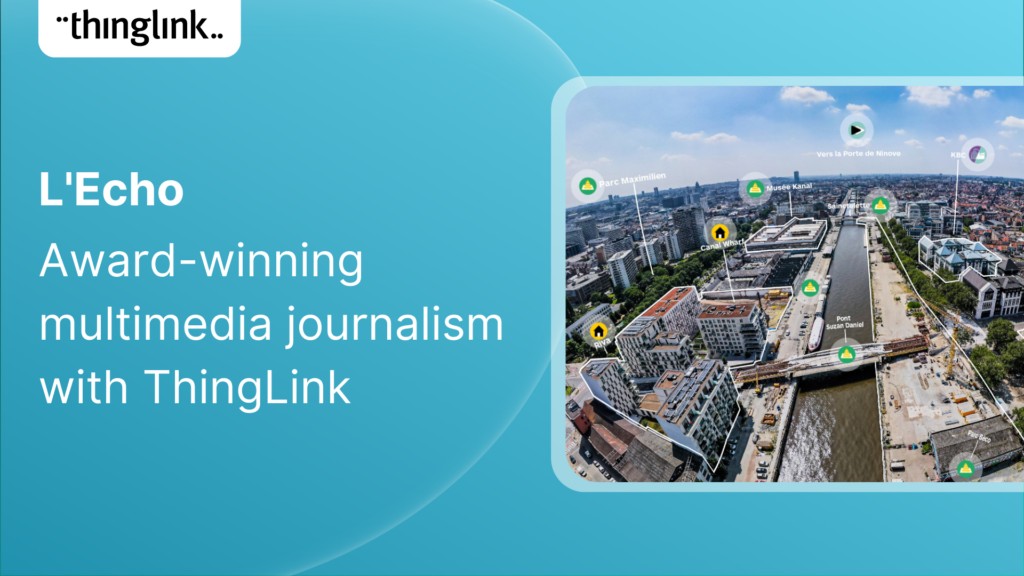
Multimedia reporting is being used ever more frequently by all media platforms. In this blog we showcase a great example of multimedia journalism from Belgium which...
Kyla Ball
5 min read
In this blog post we look at the five stages of the design thinking process and suggest innovative solutions for making the process as effective as possible. ...
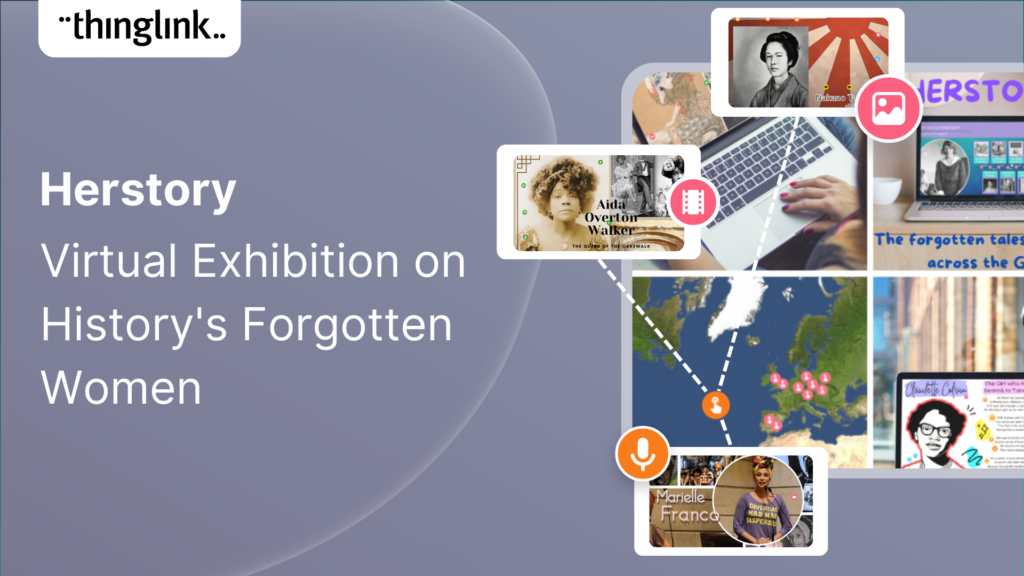
In this blog we look at how students from UCLan created a virtual exhibition about history’s forgotten women, the process they used to create it and the results...
Kyla Ball
4 min read
In this blog post, we’ll show you how to make an infographic in Microsoft PowerPoint. Working with shapes, images, icons, and text you can easily create a...
If you create or provide eLearning courses or workplace training, or you create any type of content marketing, you need to know how to use infographics. Infographics...
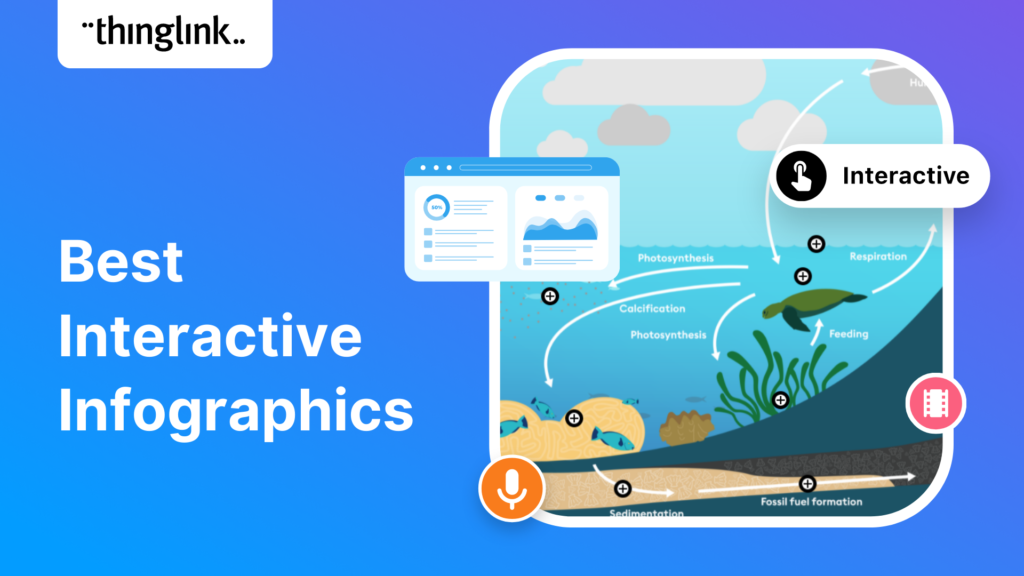
Infographics are the fastest and easiest way to present any complex information. In this blog we’ll show you how to create interactive infographic designs even...
How can you make engaging interactive infographics if you’re not a professional graphic designer? In fact, creating this type of visual content can be really ...
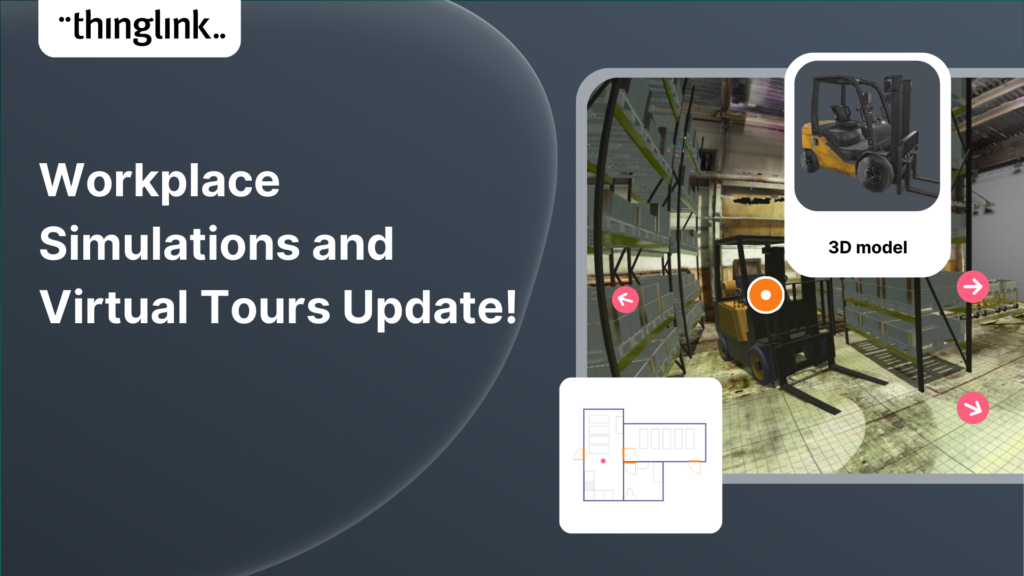
Increase the effectiveness of your online training with multimedia interactive simulations and virtual tours. eLearning course content creation is easy with ThingLink!...
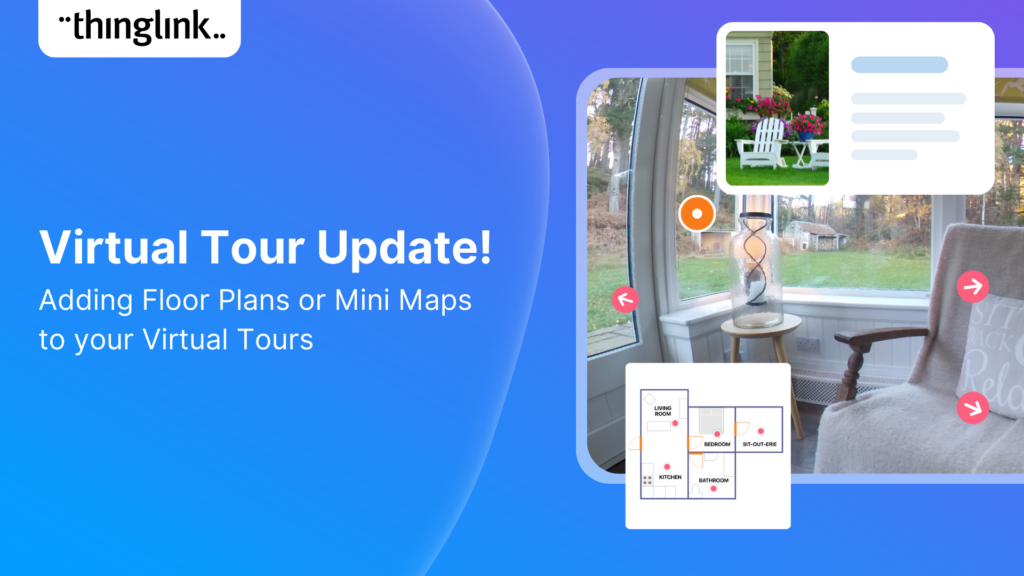
Your viewers won’t get lost with this brilliant new virtual tour feature! Our latest ThingLink update enables you to add a floor plan or ‘mini map’ that shows...
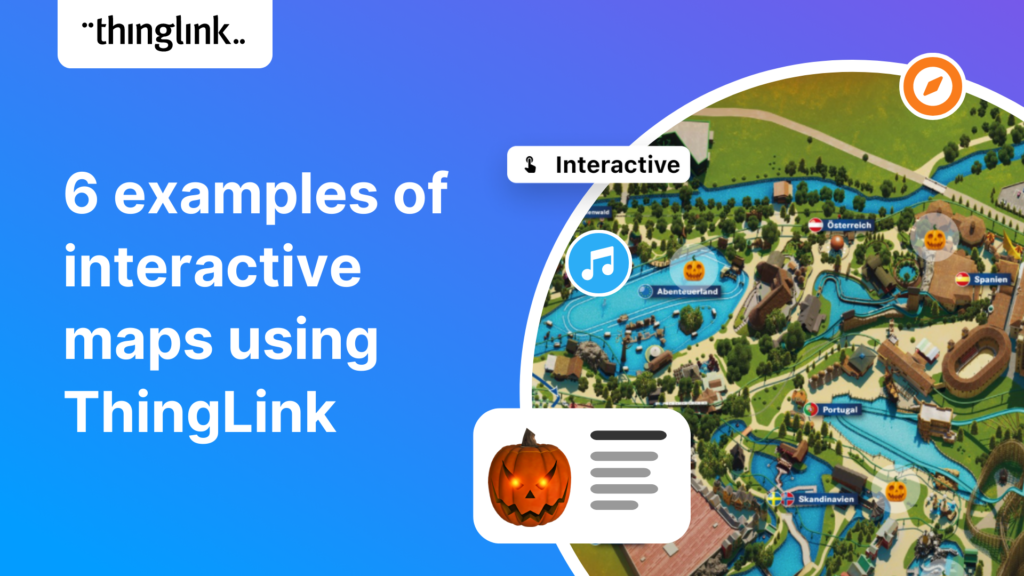
Some inspiring examples of interactive maps created by ThingLink users. Thanks to mobile apps like Google maps, we are now all used to using maps every day that...
Kyla Ball
4 min read
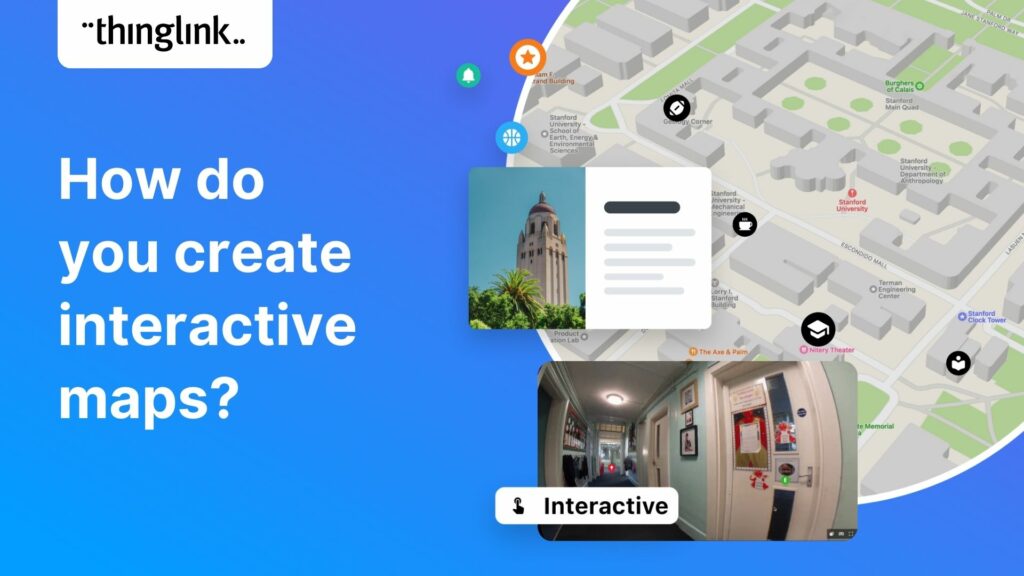
“There are those who follow maps, and those who make them.” Alberto Villoldo How to create interactive maps You don’t need to invest in an expensive...
Kyla Ball
2 min read
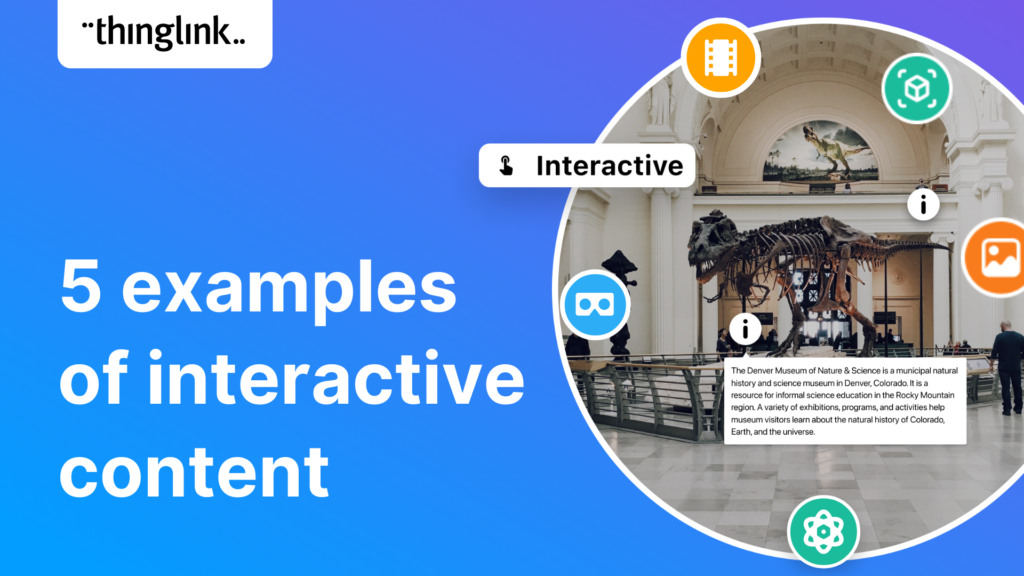
5 types of interactive content you can easily create today with ThingLink September 14, 2022 / 4 minutes of reading / By Louise Jones Stuck ...
Kyla Ball
5 min read
What is interactive content? The opposite of static or passive content, interactive content is one which users actively participate in or engage with. This...
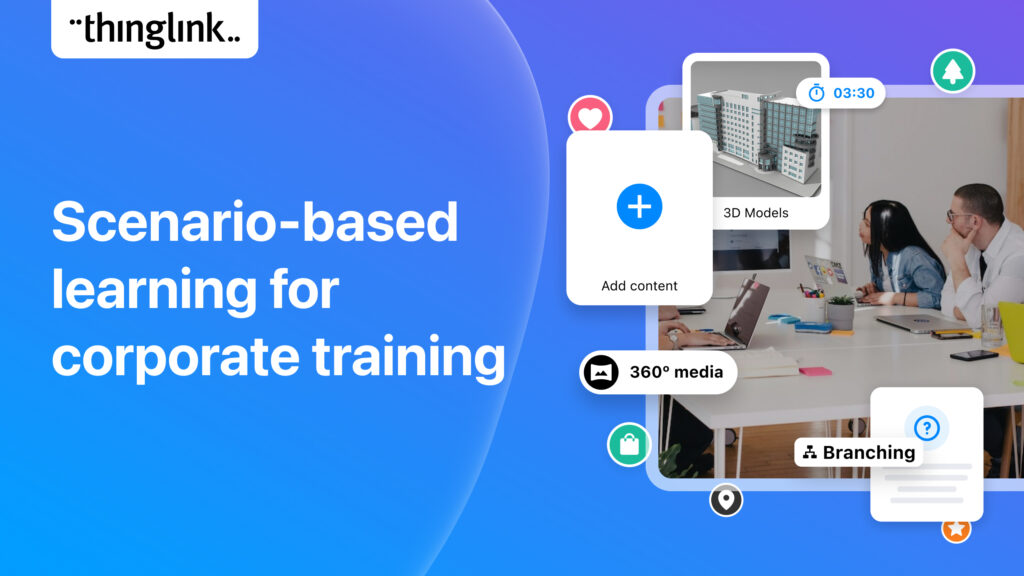
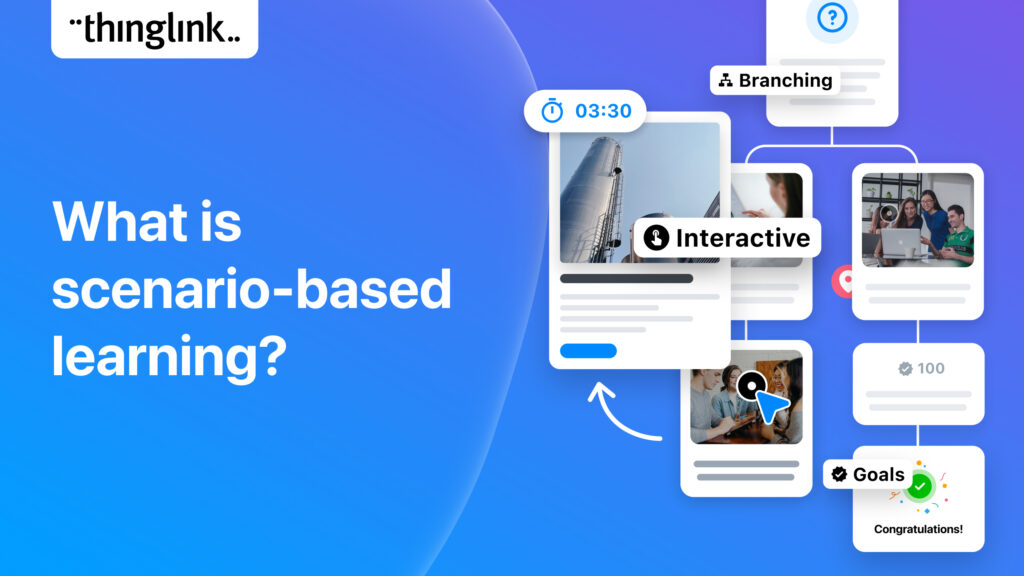
What is the future for corporate training? Scenario-based learning (SBL) is quickly becoming the industry standard for corporate learning or workplace learning ...
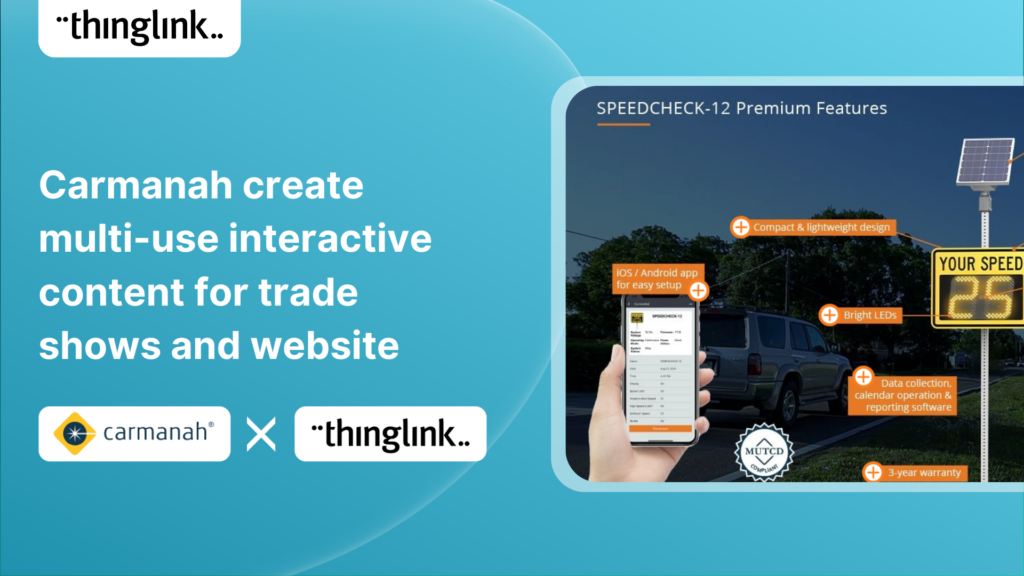
Background Carmanah is a company based in British Columbia, Canada, that helps improve road safety with a range of products including flashing beacons, radar speed...
Kyla Ball
5 min read
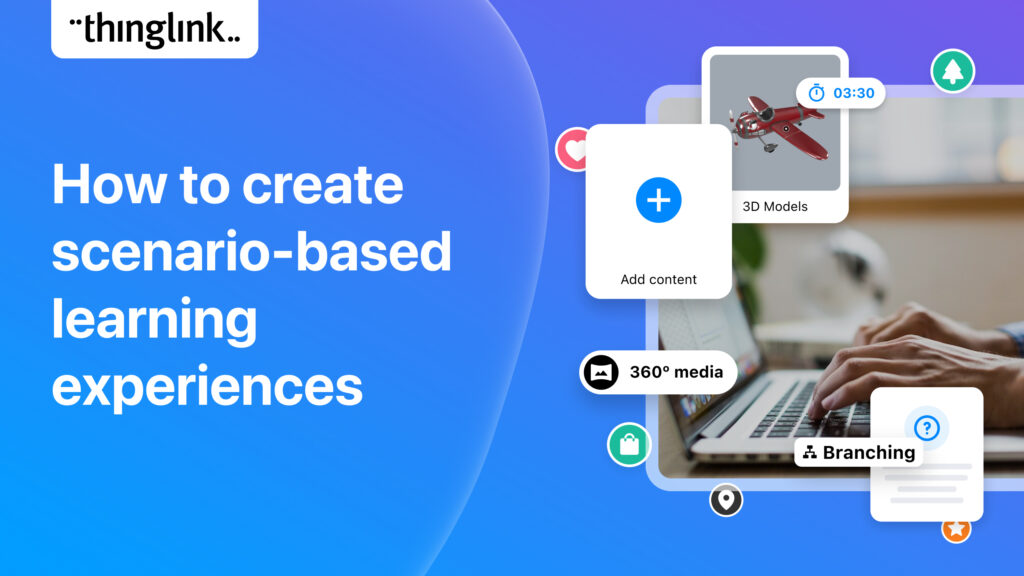
How do you create a real-life learning scenario? Step 1: What makes up a scenario-based learning experience? The 5 Simple Cs at the center of this learning theory...
Scenario-based learning (SBL) is an instructional strategy where learners pick their own path based on the choices they make. Learners are placed in interactive...
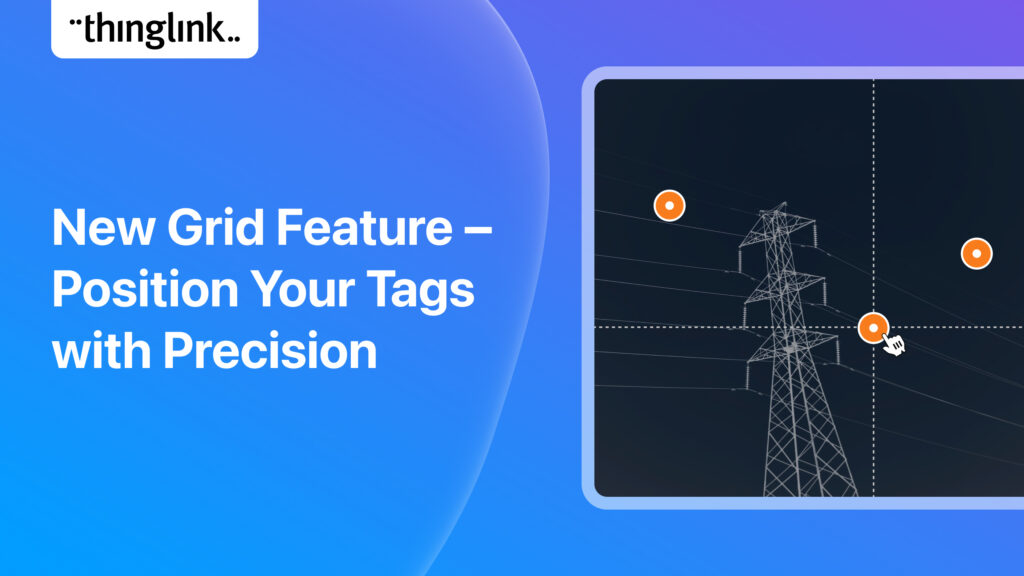
It’s now even easier to create slick and professional-looking interactive content with another of ThingLink’s handy new content tools. The Grid Feature allows...
ThingLink has been placed in an impressive three separate categories by Capterra, the free online service that helps organizations choose the right software. In...
Would you like to create your own distinctive icons to use with tags in your ThingLink content? It’s easy – we show you how! We recently added over ...
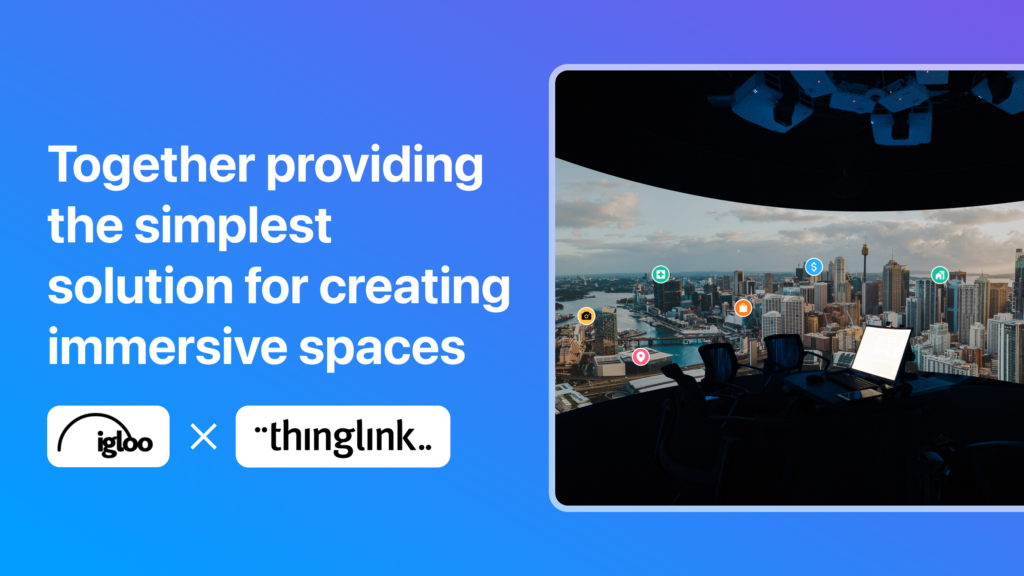
With over 20 years of visionary experience between them, ThingLink and Igloo Vision have crafted a reality for the future of immersive spaces. ThingLink is the ...
Calgary University Library creates beautifully simple virtual tours and orientation guides to assist new students with library resources We are always excited to...
Kyla Ball
5 min read
Want to create immersive and awe-inspiring content for your audiences but not sure where to start? We have the perfect course for you – ThingLink Certified...
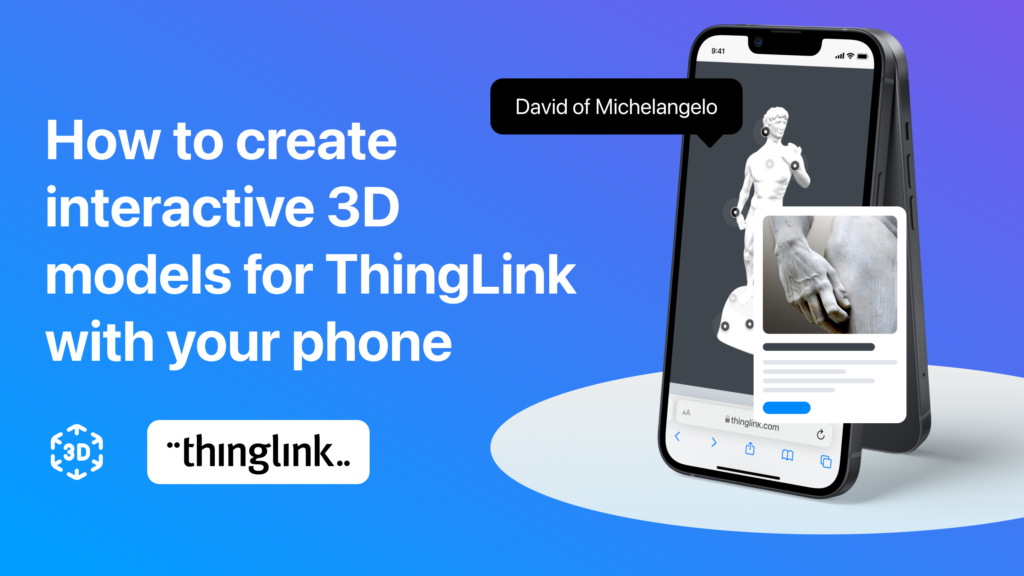
3D models are gaining popularity as the process of creating them has become more user-friendly. A few years ago you needed dedicated 3D modelling software, and ...
Web View Now Available! From today, ThingLink has a new additional ‘Web View’ function available for enhanced usability. This offers your viewers more...
Are you looking for a way for your students to find out about job opportunities, learn about education options and get feedback on their CVs? When they couldn’t...
Kyla Ball
7 min read